- Subscribe to RSS Feed
- Mark Topic as New
- Mark Topic as Read
- Float this Topic for Current User
- Bookmark
- Subscribe
- Mute
- Printer Friendly Page
Finding Power Spectrum of EMG Signal Aquired through Serial Port.
05-30-2011 10:08 PM
- Mark as New
- Bookmark
- Subscribe
- Mute
- Subscribe to RSS Feed
- Permalink
- Report to a Moderator
Hello to all biomedical user group members 
Currently for a university project I have constructed a wireless EMG measurement device. I constructed the EMG amplifer, digitized the signal using inbuilt ADC of a microcontroller (PIC16F877A or arduino) and wirelessly transmitted the digitized/serial EMG values using a pair of xbee tranceivers. The receiver xbee is connected to a USB port of a laptop, and the digitized/serial EMG values are read and displayed on a waveform chart (wireless_EMG) using the following VI (serial_arduino3.vi).
I need some suggestions/feedback on how to rectify these problems:
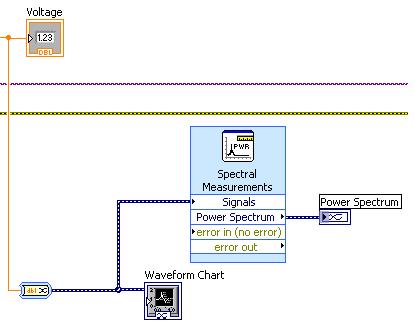
1) On this VI (serial_arduino3.vi), im not sure why the power spectrum part is not working, but i think the problem is coming from this part. The orange wire represents the EMG values. When it is wired to the waveform chart the EMG signal can be seen. However when I put 'spectral measurements' box and wire it to a waveform chart the chart is empty as shown on wireless_EMG.bmp. My target is to get real time power spectrum measurements and display it on a waveform chart/graph.
2) Also If I wire the EMG data (orange wire) to a waveform chart, the EMG signal appears, however If I wire the EMG data to a waveform graph, the graph is empty. Ho can I get these EMG measurements displayed on a waveform graph?
Thanks! I appreciate any feedback
05-30-2011 11:54 PM
- Mark as New
- Bookmark
- Subscribe
- Mute
- Subscribe to RSS Feed
- Permalink
- Report to a Moderator
Hi,
I guess the problem is that your data is streaming point by point. Waveform Chart could save the previous data and show it gradually, therefore it works. However, waveform graph is just showing what you wire, in your case, is just one point. And this Spectrum Express VI maybe could only support calculating spectrum from a signal array.
I suggest you use two loops. One is for reading signal form serial port and buffer it into some array. The other loop is to analyze the signal array.
Hope this helps.
ZJ Gu
05-31-2011 02:54 AM
- Mark as New
- Bookmark
- Subscribe
- Mute
- Subscribe to RSS Feed
- Permalink
- Report to a Moderator
Thanks ZhijunGu.
I will try using two loops and see the results
06-08-2011 10:50 PM
- Mark as New
- Bookmark
- Subscribe
- Mute
- Subscribe to RSS Feed
- Permalink
- Report to a Moderator
Hello Mr. ZhijunGu and biomedical user group members.
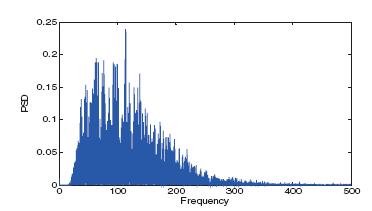
I have modified the VI i had earlier posted to include shift registers and and array to collect data (serial_arduino8). This way we can see the EMG signal on a waveform graph in real time, instead or relying on a waveform chart. However after passing the signal to the power spectrum express VI to find the power spectral density, im still unable to get the typical EMG power spectral density which lies within the 20Hz to 400Hz range such as the one shown in the figure below. The power spectral density I am getting is shown in the attachment wirelessEMG4.JPG
Perhaps the way I am using the power spectrum express VI at this stage is incorrect:
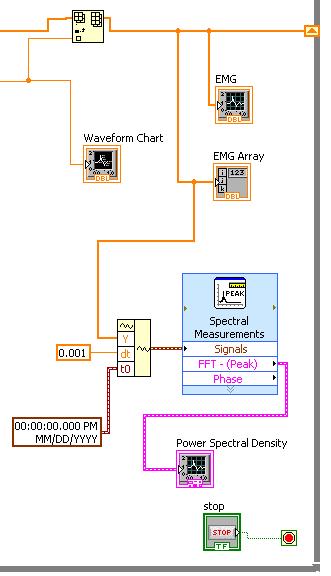
What corrections should I do on this VI in order to get a typical EMG power spectral density?
Thanks
06-08-2011 11:38 PM
- Mark as New
- Bookmark
- Subscribe
- Mute
- Subscribe to RSS Feed
- Permalink
- Report to a Moderator
Hi Jazlan,
I have three suggestions:
1. Remove DC/baseline wandering. You have high DC power which makes your graph different from your reference.
2. Try to linear unit instead of dB.
3. As you have several muscle contraction, you could use time frequency spectrogram instead of power spectrum to see each contraction over the time axis. You could find the time frequency analysis in Advanced Signal Processing Toolkit.
Thanks!
ZJ Gu
06-09-2011 02:50 AM
- Mark as New
- Bookmark
- Subscribe
- Mute
- Subscribe to RSS Feed
- Permalink
- Report to a Moderator
Thanks ZhijunGu.
In this graph I have attached (wirelessEMG4.jpg), I used an operational amplifier offset adjustment circuit, to 'bring up' the EMG signal so that the EMG signal lies within 0 to 3V. The ADC i am using on the arduino microcontroller can only except positive voltages between 0 to 3V.. This is why the EMG signal reference is not at 0.
I will try to use linear units and time frequency spectrogram and post the results.
Regards,
Jazlan
