- Subscribe to RSS Feed
- Mark Topic as New
- Mark Topic as Read
- Float this Topic for Current User
- Bookmark
- Subscribe
- Mute
- Printer Friendly Page
rat pup ECG
04-01-2010 11:32 AM
- Mark as New
- Bookmark
- Subscribe
- Mute
- Subscribe to RSS Feed
- Permalink
- Report to a Moderator
Hello everyone,
I'm starting a project to record rat pup ECG and analyze them for HR and HRV (R-R interval). Rats has very high heart rates compared to humans and rat pups have even higher (around 300bpm is not rare). To collect my signal I've made a simple instrumentation amplifier with 3 inputs: +, -, and GND. This amplifier is hooked up to a NI USB-6210 DAQ for digitization. I'm recording at 1000Hz and this all seems to work fine. I can see the peaks when I graph the data. I haven't started working on the analysis VI yet, but I was hoping you all could help me sort out a few issues I'm anticipating having. I don't need to do any of the analysis real-time, which makes this project considerably easier. Here are the issues I'm anticipating:
1) I'm getting a lot of signal drift, although it's considerably better than the first iteration of my instrumentation amplifier. I don't think I have the Advanced Signal Processing Toolkit, though I may be wrong. I'm working with the Full Development version right now. Does anyone have any ideas about how I could correct for my signal drift using just the Full Development? I considered doing a linear fit and subtracting the difference, but that just seems wrong to me. All the interesting detrending VI's I found in the discussion forum relied on the Advanced Signal Analysis Toolkit, so I'm a little bit at a loss.
2) During my data collection, I get a few periods of ridiculously high voltage measurements followed by a return to "baseline". My signal is just a few milivolts, but these periods often have voltages of 3-4V. These would clearly mask any signal that I am trying to detect, so I need a way to account for these. I considered just chopping them out manually, but this seems a little arguous and silly. Any thoughts on how to account for these periods? I'm not sure what's causing them, but I'm investigating this intensely.
3) High and low frequency noise is also apparent in my signal. I'm assuming a pair of high-pass and low-pass filters could take care of this. Any thoughts about this?
4) I'm also assuming that the peak detection can be done with the Waveform Peak Detection VI. Will I run into any trouble with this? Will I be able to use this VI to calculate my R-R intervals?
My first thought was to use the Biomedical Startup Kit to do all this. I was able to use it to log my data without any issues. The ECG Feature Extractor was unable to detect any peaks though, so it doesn't seem like I'm going to be able to use the stuff that's already been written unless I can get some help from NI in adjusting the kit to meet my needs. Does anyone have any ideas about how I might be able to tweak the kit to work? I requested the source code from NI, so hopefully that will come soon and I can work on that.
Does anyone else see anything in my data that I should be worried about while I plan my analysis VI? A sample is attached below, which includes the high voltage issue I mentioned earlier. Oh, if it makes a difference, I'll be recording HR continuously for 3 hours under a series of different conditions to monitor for physiological response to the conditions. So, we're dealing with a lot of data.
Thanks everyone for your thoughts and for any help. I figured it would be better to think of these issues early in the process than late.
Matt
04-01-2010 12:34 PM
- Mark as New
- Bookmark
- Subscribe
- Mute
- Subscribe to RSS Feed
- Permalink
- Report to a Moderator
Hi Matt,
I haven't had a chance to open your data file (a screen shot of the data would be a quick way for us to see these peaks without having to open a TDMS file). However, I have some quick thoughts:
1. To handle the drift, just add a high-pass filter with a cut-off of something like 0.1 to 0.5Hz. Normally an ECG instrumentation amplifier has this as part of the analog signal path to block DC and drift (since the DC component doesn't carry any useful information anyway). If your amplifier isn't already AC coupled, I would look into adding this to your circuit. If it is already AC coupled, you may want to make the time-constant shorter (higher cut-off). Since you already have digital implementations of these filters in the Full package of LabVIEW you can experiment first with these and see if that's all you need to do to fix the drift issue (there is a bunch of IIR and FIR filters to choose from - just pick something simple like a 1st-order Butterworth to start with). You don't need the Advanced Signal Processing Toolkit or Digital Filter Design Toolkit.
2. The big transients that you are seeing may be a result of movement artifact - large DC shifts in the electrode offset potentials that get amplified by your differential amplifier. These are difficult to deal with and may be best handled during data processing by having your analysis routine exclude data segments that are outside of some normal range. You may want to make your analysis routine smart enough to recognize these bad data segments vs. good data and ignore it. I have also seen other semi-automatic approaches where you go through the data manually and tag segments (by time-stamp) for exclusion and then let the analysis routine run through the file and exclude these tagged time-segments. This approach could get old for 7 hours worth of data...
3. As already mentioned above, the high and low pass filters are standard in the Full package. The high-pass was covered above (should help solve your drift problem) - you should definitely add a low-pass filter to your processing algorithm (and pre-display) to clean up the data. Often these filters are not applied to the data going to disk so that you can "undo" the filtering or change the filtering scheme if you want to later. If you over filter the data as you save it, you cannot get the original data back.
4. Without seeing the data it's hard to say, but I'm pretty sure the peak detect VI will do what you want. You may want to further process the data before it goes to the peak detect VI to sharpen it up and improve the discrimination of peaks. Sometimes a more aggressive high-pass filter helps, sometimes taking the derivative of the waveform really causes the rising or falling edges to jump out so that they are then easy to catch with a peak detector.
Steve
04-01-2010 09:13 PM
- Mark as New
- Bookmark
- Subscribe
- Mute
- Subscribe to RSS Feed
- Permalink
- Report to a Moderator
Hi,
ECG Feature Extractor in Biomedical Startup Kit is designed for human. You should adjust some internal parameters (in source code version not available in executable) when apply it to animals. This may be a little difficult.
I try to use Digial Filter Design Toolkit to design a filter to remove the baseline and use Wavelet Peak Detection function in Advanced Signal Processing Toolkit :


Thanks!
ZJ Gu
04-02-2010 04:58 AM
- Mark as New
- Bookmark
- Subscribe
- Mute
- Subscribe to RSS Feed
- Permalink
- Report to a Moderator
Hi
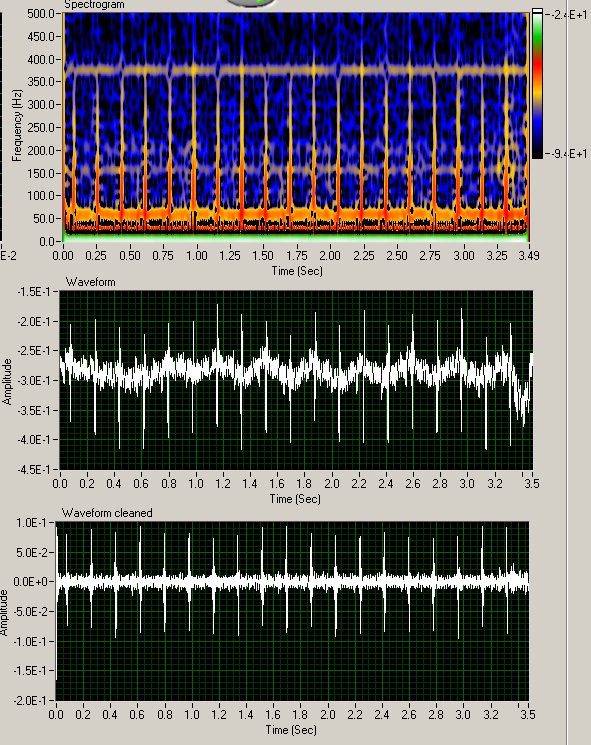
I did some joint time frequency analysis on your signal. And from what I can see, you do not any fancy tools to clean up your signal. A low order high pass filter will do the work. You could perhaps implement as an analog filter. If we look at the signal analysis we see that each heart beat produces quite high frequencies. but around the mains frequency (60 Hz in your case I guess) and below we have a constant noise carpet. In your case I would experiment with a high pass filter with a cutoff somewhat above the mains frequency. You can use analog or digital. And perhaps increase the sample frequency, say 2 to 5 KHz. If you use proper storing format (not .lvm  ) and store your numbers as SGL (4 bytes). The disk cost will be around 70Mb per hour(5 KHz). Not to much in our days.
As I can see your project will require some programming but if you have a more advanced Labview version than the Labview Base. All functions should be included. I also believe the source code for the Biomedical Startup Kit is available so you can use this for inspiration. But if some toolkit are required and the it is to much for your budget. You will be able to create a HRV spectrogram by using standard peak detection and a function named "Unevenly Sampled Signal Spectrum.vi" If you go to help in the toolbar and Find Examples. You can search for Unevenly. Locate the "Generalized Fourier Spectrum.vi" and use this as an example
You may also perhaps gain something by using a more advanced frontend. In the link below you will find a circuit that incorporate many interesting design elements. You can use it as a reference design and modify it as it is made for human ECG. A3 as an example is used simple low pass filter with a corner frequency around 100Hz. And that will not fit your application at all. I would have replaced it with a 2. order high pass filter. The circuit use somewhat exotic ICs, but you do not have to use the exact same circuits. But some high quality opamps are needed (not 741 or lm324  ) It is also designed for a signle ended supply voltage. But as I understand you are a technical student so will be able to modify as needed.
http://focus.ti.com/pdfs/vf/medeq/informationformedicalapplications.pdf
Good luck and feel free to post again if some discussion around the your project is needed.

Besides which, my opinion is that Express VIs
(Sorry no Labview "brag list" so far)
12-22-2010 11:05 AM
- Mark as New
- Bookmark
- Subscribe
- Mute
- Subscribe to RSS Feed
- Permalink
- Report to a Moderator
Hey everyone, I just posted a follow-up discussion to this one, which includes more specifics about my recording and analysis, as well as another example of the data. If you're interested in this discussion, please head over here: http://decibel.ni.com/content/thread/8715?tstart=0
