- Subscribe to RSS Feed
- Mark Topic as New
- Mark Topic as Read
- Float this Topic for Current User
- Bookmark
- Subscribe
- Mute
- Printer Friendly Page
Velocity Curve to FFT Curve
07-16-2008 08:49 AM
- Mark as New
- Bookmark
- Subscribe
- Mute
- Subscribe to RSS Feed
- Permalink
- Report to a Moderator
I'm in need of some advice with how to implement some signal manipulation. I have a task that I'm taking in a signal through an accelerometer, and calculating the average in/second vibration. This part is done, but now I have been asked to recreate the attachment that I placed with this message..its an FFT graph (1 channel...there will actually be 3, but they will need to be on seperate indicators.
I've seen some VI's that perform FFT but when I send the simulated vibration into my program and take the fft of my velocity waveform...it doesn't look a thing like whats shown. For starters...the peaks seem to be connected on the drawing.
I do have sound and vibration toolkit, and LV8.5.....I'm by no means a signal expert just to throw that out there lol
07-16-2008 09:54 AM - edited 07-16-2008 09:56 AM
- Mark as New
- Bookmark
- Subscribe
- Mute
- Subscribe to RSS Feed
- Permalink
- Report to a Moderator
If you are able to successfully generate the velocity vibration signal, you can use the SVT Power Spectrum VI to convert that to a spectrum. The frequency resolution and maximum frequency in the spectrum are determined by the sample rate and period of the simulated vibration signal. You can use the SVL Integration (frequency) VI and the SVFA Unit Conversion VI to help you achieve the correct magnitude units for your spectrum. Lastly, you will have to convert the frequency units from Hz to CPM (Hz=CPS --> CPS*60=CPM).
From your description, it is hard to know whether the simulated vibration signal is for a steady-state vibration or whether this is the vibration from a run-up or coast-down simulation. If the frequencies are changing with time, use the OAT Order Power Spectrum VI to compute the spectrum as it normalizes signal components to the running speed.
I hope this helps. If not, please provide some more details and even some data that we can chew on.
Message Edited by dsb@NI on 07-16-2008 09:56 AM
Enthusiast for LabVIEW, DAQmx, and Sound and Vibration
07-16-2008 10:56 AM - edited 07-16-2008 10:57 AM
- Mark as New
- Bookmark
- Subscribe
- Mute
- Subscribe to RSS Feed
- Permalink
- Report to a Moderator
Your advice has me going in the right direction, really appreciate it -
I've gone ahead and attached the code I have completed so far, and to answer your question - the vibration input will be steady-state. (For testing purposes at my desk I'm just using a little shaker table. For production purposes we will ramp up our product - and once steady we will take the measurement and perform the calculations.
Maybe this helps a bit - looking at the code you posted, it looks like I'm doing some of what you've done. I've performed the integration, but you convert g's to power spectrum first which I don't do....I'm going to tinker, but honestly I'm still a bit confused on the explanation?
Thanks for the help,
Don
Message Edited by leachdor on 07-16-2008 10:57 AM
07-16-2008 12:42 PM
- Mark as New
- Bookmark
- Subscribe
- Mute
- Subscribe to RSS Feed
- Permalink
- Report to a Moderator
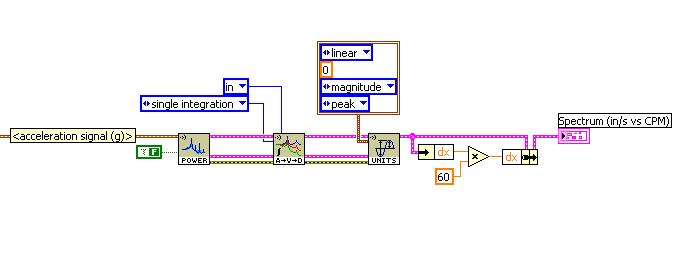
If you need access to the time-domain velocity signals, then you must perform the integration on the signals before performing the power spectrum. If you only need the velocity vibration spectrum, I recommend that you perform the integration on the measured power spectrum. The time-domain filters used to implement the integration require a certain number of samples to settle whereas the the frequency-domain integration is just a frequency-dependent scaling of the spectrum (no filters means no delay, no transient behavior, and perfect frequency response). If your DUT has already reached steady state when the VI acquires the data, you could simplify your code by integrating the power spectrum and removing the Express VI that gets a subset of the signal.
Other observations:
Max-min level is equivalent to pk-pk measurement for a steady state sinusoid
Use the integration VIs (see above screenshot) to be able to convert g to in/s^2 internally. The Express VI always returns results in SI units.
Enthusiast for LabVIEW, DAQmx, and Sound and Vibration
07-16-2008 02:49 PM
- Mark as New
- Bookmark
- Subscribe
- Mute
- Subscribe to RSS Feed
- Permalink
- Report to a Moderator
Wanted to send along an update and see if what I did makes sense (I'm not sure if the output is as should be)
I've attached 3 pictures:
The first shows trying to use the Unit Conversion Vi that you used....I get an error on a wire when going into a cluster that you didn't seem to get.
The second shows that I used the express VI that I suppose does the same thing, but the output worked fine - I'm OK with this method if its correct!
The third picture shows my output using the second picture's code....
The source is a 60hz. shaker table...I'm shaking at 1mil pk-pk (0.184g's pk).
The questions are the units I'm seeing....since I'm using the 60 multiplier...do I just need to change the axis title to CPM or didn't I do it properly...and it should have made that change on its own?
Also...on the Y-axis the sample picture that we're trying to mimic shows a high of 0.1in/sec...Is that telling me that i'm at a peak of ~0.525in/sec? Maybe my math is off but 1mil (pk-pk) = 0.188 in/sec (pk) = 0.376 in/sec (pk-pk) This is a big question for me?
Thanks for all the assistance
.PNG)
07-16-2008 05:50 PM
- Mark as New
- Bookmark
- Subscribe
- Mute
- Subscribe to RSS Feed
- Permalink
- Report to a Moderator
Enthusiast for LabVIEW, DAQmx, and Sound and Vibration
07-16-2008 06:00 PM - edited 07-16-2008 06:01 PM
- Mark as New
- Bookmark
- Subscribe
- Mute
- Subscribe to RSS Feed
- Permalink
- Report to a Moderator
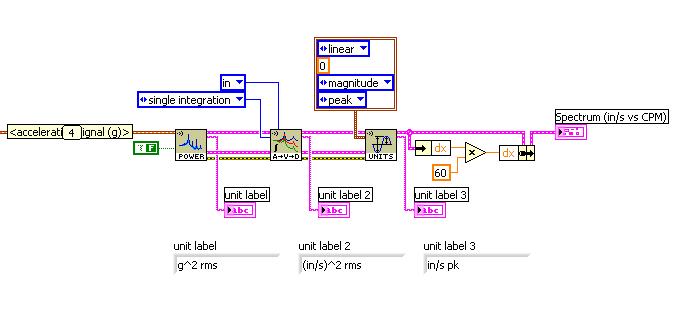
You can use the unit label outputs of the VIs and Express VIs to verify your units.
Message Edited by dsb@NI on 07-16-2008 06:01 PM
Enthusiast for LabVIEW, DAQmx, and Sound and Vibration
07-18-2008 03:08 PM
- Mark as New
- Bookmark
- Subscribe
- Mute
- Subscribe to RSS Feed
- Permalink
- Report to a Moderator
Thought I'd follow-up on this one. I was able to get rid of that error by changing the spectrum VI to be 1 channel. I made some modifications as you recommended (integration block and units conversion) as you can see in the picture. Gonna leave the power spectrum express vi's up for now.
We're not getting the same results as expected though. The system that we are replacing doesn't match the values we see with our lab setup. I ran the old one with all 3 axis, then using a laptop recaptured using NI and our vibration values we saw:
Old system: max in/sec reading 0.01
NI: max in/sec reading 0.08
Recalibrated everything and still get similar results...going to investigate more next week. Odd thing is I'm able to match the readings using a 3rd set of instrumentation that we bought 1 set of before settling on NI. I'm measuring average max pk-pk in time domain, and peak on FFT. Those 3 values you see at the bottom of picture 2 are calculated at the bottom part of the code where you see the signal subsets. Also to answer your question, the subset should be removing all transient response...I gave it a 2 second cutoff on the front, thats how long the settling time is for the sensors.
For troubleshooting purposes, are you able to add a cursor on the curve and have it show the values as you move it along the waveform? I remember doing this or something like it back in college, but other than making visible a cursor legend - I'm not sure how to make the values change.
07-21-2008 10:18 AM
- Mark as New
- Bookmark
- Subscribe
- Mute
- Subscribe to RSS Feed
- Permalink
- Report to a Moderator
Enthusiast for LabVIEW, DAQmx, and Sound and Vibration
07-25-2008 08:10 AM
- Mark as New
- Bookmark
- Subscribe
- Mute
- Subscribe to RSS Feed
- Permalink
- Report to a Moderator
I send you the code I'm using, and my sample later this evening (Have to grab the shaker table again)
How do you want the time domain data? I know I can save these waveforms as UFF58 using SVT...would that be a good way?
