- Document History
- Subscribe to RSS Feed
- Mark as New
- Mark as Read
- Bookmark
- Subscribe
- Printer Friendly Page
- Report to a Moderator
- Subscribe to RSS Feed
- Mark as New
- Mark as Read
- Bookmark
- Subscribe
- Printer Friendly Page
- Report to a Moderator
I put together a little tool that will allow you to build a dependency matrix for all classes in a project and then visualize the class dependencies in a Dependency Wheel using the JavaScript D3.js library.
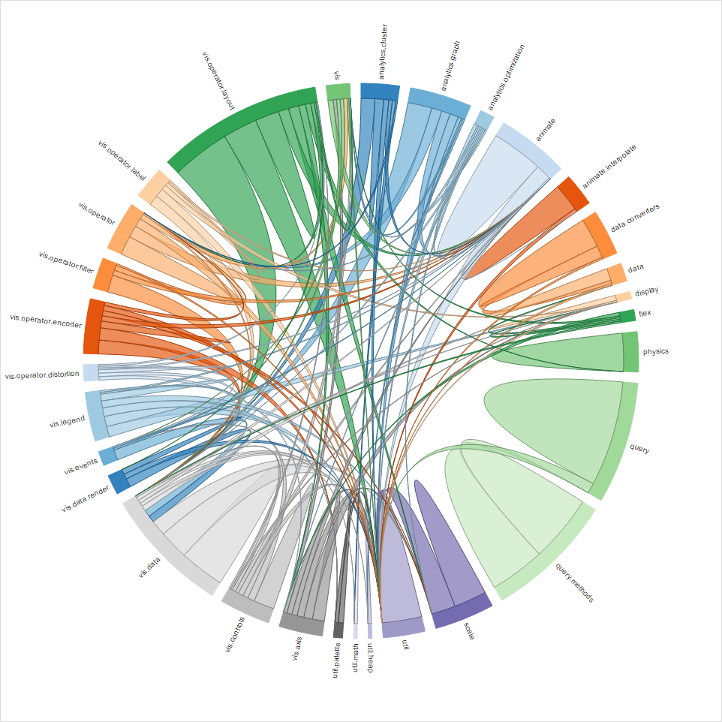
I think it is a nice way to visualize the source code dependencies between your classes. If you would like to see it in action check out my blog posts here and here. You can download a VI Package (for LabVIEW 2014 and higher) from this post as well.
I just updated the viewer per jlokanis's suggestions below, improving usability and adding a new type of visualization for force directed graphs. The force directed graph is pretty cool as it is clickable, zoomable and extremely interactive. Take a look and let me know what you think
Thanks
Jon
- Mark as Read
- Mark as New
- Bookmark
- Permalink
- Report to a Moderator
Cool debugging tool. I can see how this would be useful for smaller projects. I just tried it on one of my medium sized projects and it was a be overwhelming.
I have a few suggestions for improving the interface:
1. On a medium to large project it takes quite awhile to run even if you only select a few classes. I would suggest you add a progress bar so we can see it is still running and have an estimate of how long it will take.
2. You should consider using a tree and showing classes inside lvlibs as branches on the tree of the root lvlib. This would allow exclusion of classes in an architecture more easily so the user can focus on the code they created in the project.
3. Due to the density of the graph for medium and large projects, it would be nice if there was an option to select a particular class and only graph it and it's dependencies.
4. You need to support selection using ctrl and shift modifiers as is standard for listbox selection.
5. You need a select/deselect all option. Could even just be implemented as a right-click menu.
6. The selected/deselected display method is way too busy for clarity. Both and X and overstrike make reading/scanning the list difficult. I would simply have the check mark for selected and nothing for deselected. And lose the overstrike. That would make viewing the selection much simpler and clearer.
7. The resulting graph is too big for a standard 1080p display. Is there any way to allow zooming out without shrinking the text beyond readability?
8. I like the idea of the force directed graph. (I have also heard these called node-maps.) That might be a better display when focusing on a single class. It would also be nice if there was a way to navigate the map like this tool allows: https://www.visualthesaurus.com/
Checkout this post I did a few years ago along the same lines. https://lavag.org/topic/16823-node-map-tool/
LabVIEW really needs a tool like this. Thanks for putting in the effort to build this. I look forward to seeing where it goes!
-John
------------------------
Certified LabVIEW Architect
- Mark as Read
- Mark as New
- Bookmark
- Permalink
- Report to a Moderator
Hey John,
Thanks for the feedback! Yes! on 1-6. 7 involves the javascript code, I will have to take a look at it and see if there is a smart way to determine the dependency wheel diamater. 8. Force directed graphs should be an easy addition, at least simple force directed graphs. I will take a look at visual thesaurus and see what kind features it offers.
Thanks,
Jon
- Mark as Read
- Mark as New
- Bookmark
- Permalink
- Report to a Moderator
Trying out the new version. Just a few observations: (sorry if these seem a bit nit-picky)
- When I disable an lvlib, the contents are disabled but the lvlib is not grayed out. So the only way to know if you disabled the lvlib is to expand it.
- Graying out unselected items may not be the best way to mark your selection. I think you should use a check mark for selected and no check mark for unselected. At the very least, choose a color that is not as light since the current gray is almost unreadable on my screen.
- Let me double-click an item to select/unselect it.
- The force directed graph is cool but when it renders it starts moving and does not stop for several minutes in my browser. What is it doing?
- Not sure what the 'First Order' option is for. Can you add some description?
I think the project I am testing this with just has too many dependencies to view reasonably.
------------------------
Certified LabVIEW Architect
- Mark as Read
- Mark as New
- Bookmark
- Permalink
- Report to a Moderator
Hey John,
The first order option lets you pick a class and select only its first order dependencies for visualizing. I think this option will help you to view subsets of your class hierarchies for your large projects.
Good feedback with your other items!
Thanks,
Jon
- Mark as Read
- Mark as New
- Bookmark
- Permalink
- Report to a Moderator
Hi John,
This is a cool thing. Similar to this, I think of making use javascript table in my LabVIEW application. I don't want to show it in the browser, but in the VI front panel directly. Is there a way to do this?
Thanks,
Ajay.
Ajay MV
- Mark as Read
- Mark as New
- Bookmark
- Permalink
- Report to a Moderator
Hi Jon,
Just updated to the new version and I'm really liking it!
One suggestion - it may be cool to be able to save and load configurations of the items you have selected/enabled. For instance, I find myself running this occasionally on a medium/large sized Actor Framework project I'm working on at the moment to get an idea of dependencies between a number of classes within the core libraries while ignoring the glut of message classes; as a result I often run through the project tree only to select the same items each time.
But otherwise I find that it's a really nice resource, Kudos.
Laurence.
- Mark as Read
- Mark as New
- Bookmark
- Permalink
- Report to a Moderator
Hi Jon,
I just tried this dependency viewer and I couldn't understand out how it shows the dependency. Please find the below image where I have put the class hierarchy and force chart dependency viewer side-by-side. Though some dependencies makes sense to me, I don't understand other dependencies (like why SoundCard & SoundVisualizer is showed as dependent on Sound Class).
Thanks,
Ajay.
Ajay MV
- Mark as Read
- Mark as New
- Bookmark
- Permalink
- Report to a Moderator
Hi Ajay,
When you get a chance, create a new project and add the SoundCard class to it, then look in dependencies and see if the Sound class is listed in dependencies. If it is, right click on it and have it show you why it is in dependencies. You can do the same thing with the SoundVisualizer class. This will be the easiest way to figure out why the dependency viewer is listing these classes as being dependent.
Best Regards,
Jon
- Mark as Read
- Mark as New
- Bookmark
- Permalink
- Report to a Moderator
Hi Laurence,
I like your idea of adding functionality that remembers how you configured a project for viewing. This shouldn't be too hard to implement, I will add it to my list and look into it when I get a chance.
Best Regards,
Jon
