Graphs allow displaying data in linear or log scale.
This doesn't go without glitches, so my first suggestion would be fix all the annoying bugs which exist.
But a common way to get motivated to fix a bug being to implement a few feature, here is a unique opportunity:
Implement symmetric log scales (aka symlog scale) on all Graphs
What is a symlog scale, you will ask?
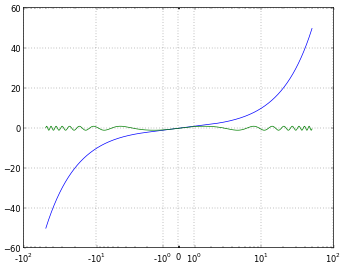
It is a log scale accepting negative arguments.
If x > 0, then Log(x) is computed (and labeled "x", hence the log scale apparence).
if x < 0, -Log(-x) is computer and labeled "x"
To get a visual representation of what this all mean, Google "symlog scale" and you will most likely end up on this page from which I am linking this figure:
Of course this should work on both axes (or all 3 axes for a 3D Graph).
The benefit is that when a curve has negative values, using a log scale to represent the plot results in a clipped plot. All negative values are gone, leaving gaps in the plot. The only way to visualize them is to revert to a linear scale, which now clumps all small positive values to pretty much the same location on the axis.
