Turn on suggestions
Auto-suggest helps you quickly narrow down your search results by suggesting possible matches as you type.
Showing results for
Topic Options
- Subscribe to RSS Feed
- Mark Topic as New
- Mark Topic as Read
- Float this Topic for Current User
- Bookmark
- Subscribe
- Mute
- Printer Friendly Page
extracting signal data into the script node
Member
06-11-2007 03:01 PM
Options
- Mark as New
- Bookmark
- Subscribe
- Mute
- Subscribe to RSS Feed
- Permalink
- Report to a Moderator
Hello,
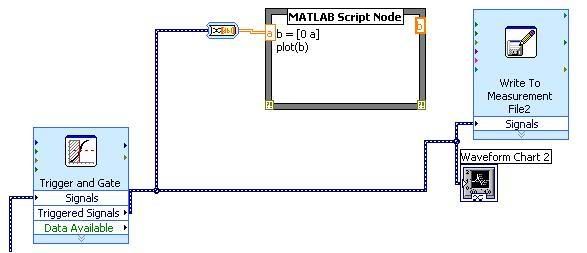
I'm trying to save the signal data into an array to plot it. I have a voltage signal from a pressure sensor, and the trigger only passes the bumps through. We're able to get the data saved into spreadsheet, but we want the VI to be able to graph the data automatically and display it also, and give the user the option of saving the graph. I don't think there's a way to do it in Excel, so I'm trying to do it in Matlab.
I'm trying to figure out the commands to convert the data into an array, so then it can be plotted, and also saved as a .mat file.
Thanks!
Nate
Knight of NI
06-11-2007
03:16 PM
- last edited on
01-28-2025
12:25 PM
by
![]() Content Cleaner
Content Cleaner
Options
- Mark as New
- Bookmark
- Subscribe
- Mute
- Subscribe to RSS Feed
- Permalink
- Report to a Moderator
This forum is actually for Mathscript, not for a matlab script node.
Sorry, I don't understand the need for the matlab node at all here. Why don't you just use a LabVIEW waveform graph to graph the data?
06-11-2007 03:20 PM
Options
- Mark as New
- Bookmark
- Subscribe
- Mute
- Subscribe to RSS Feed
- Permalink
- Report to a Moderator
Oops, didnt realize I was in the wrong forum.
I don't think the waveform graph can be saved, can it? I would like to be able to save each individual spike, not the entire ten seconds of data.
I don't think the waveform graph can be saved, can it? I would like to be able to save each individual spike, not the entire ten seconds of data.
06-12-2007 05:32 PM
Options
- Mark as New
- Bookmark
- Subscribe
- Mute
- Subscribe to RSS Feed
- Permalink
- Report to a Moderator
Hi,
So I've replaced the Matlab script node with Mathscript, it seems like Mathscript is more robust anyways. However I still have the same problem, is there a command or function that can help me get those voltage signals into the Matlab environment for further manipulation?
Thanks for your help!
Nate
So I've replaced the Matlab script node with Mathscript, it seems like Mathscript is more robust anyways. However I still have the same problem, is there a command or function that can help me get those voltage signals into the Matlab environment for further manipulation?
Thanks for your help!
Nate
