- Subscribe to RSS Feed
- Mark Topic as New
- Mark Topic as Read
- Float this Topic for Current User
- Bookmark
- Subscribe
- Mute
- Printer Friendly Page
Chart plotting in real time
02-12-2007 04:22 PM
- Mark as New
- Bookmark
- Subscribe
- Mute
- Subscribe to RSS Feed
- Permalink
- Report to a Moderator
02-12-2007 05:58 PM - edited 02-12-2007 05:58 PM
- Mark as New
- Bookmark
- Subscribe
- Mute
- Subscribe to RSS Feed
- Permalink
- Report to a Moderator
It sounds like you may benefit from using a waveform data type.
Wire up this VI
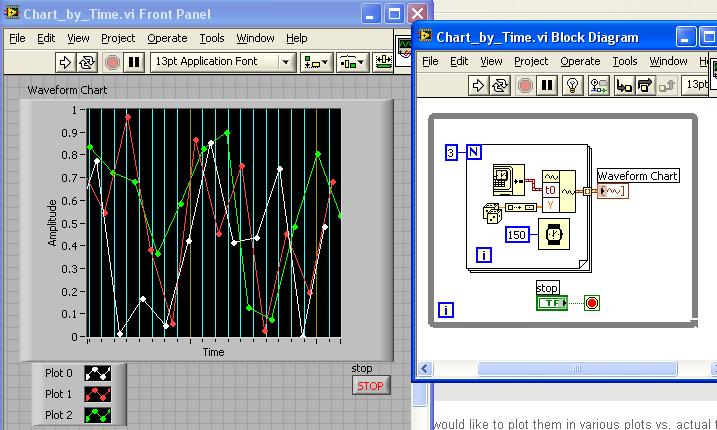
and you will see that the chart will plot the data points at the times you specifiy.
Notes:
Click on chart and make sure Ignore attributes" is NOT clciked.
If you srent a new number of plots than previous updates
or
You specify a time for a plot that is prior to a point that is already plotted
Then
THe chart will reset.
You can specify the time interval of periodic signals by specifying the dt, and presenting an array with more than one element.
You can force a gap (lift the pen) by posting NaN.
Have fun,
Ben
Message Edited by Ben on 02-12-2007 05:59 PM
