- Subscribe to RSS Feed
- Mark Topic as New
- Mark Topic as Read
- Float this Topic for Current User
- Bookmark
- Subscribe
- Mute
- Printer Friendly Page
DAQ frequency measurement
12-19-2007 01:50 PM - edited 12-19-2007 01:55 PM
- Mark as New
- Bookmark
- Subscribe
- Mute
- Subscribe to RSS Feed
- Permalink
- Report to a Moderator
Message Edited by immortalc on 12-19-2007 01:55 PM
12-19-2007 02:51 PM
- Mark as New
- Bookmark
- Subscribe
- Mute
- Subscribe to RSS Feed
- Permalink
- Report to a Moderator
You can't use the Tone Measurements function and expect accurate results if you acquire DBL data. The data has no timing information. When you convert to dynamic data, it's going to assume a dt of 1. Acquire a waveform data type instead if you want to use the analog in.
The counter input expects a TTL type signal.
12-20-2007 03:00 PM
- Mark as New
- Bookmark
- Subscribe
- Mute
- Subscribe to RSS Feed
- Permalink
- Report to a Moderator
Making a Frequency Measurement with an Analog Input Channel
http://digital.ni.com/public.nsf/allkb/0A335655A8FF2C69862570BD0052DFDA?OpenDocument
There are also many resources online to help you learn LabVIEW. The link below would be a great start!
LabVIEW Introduction Course - Three Hours
http://zone.ni.com/devzone/cda/tut/p/id/5243
Chris Delvizis
National Instruments
01-02-2008 02:33 PM
- Mark as New
- Bookmark
- Subscribe
- Mute
- Subscribe to RSS Feed
- Permalink
- Report to a Moderator
Thanks for your help Chris. I was looking for something like that.
I tried out the new sample program (analog in freq meas vi) from the first link you sent and that works great!
However, I copied most of the freq meas vi block into my orignal program and it seems like i can only display one measurement. It's either my original graphs or that NEW frequency display but not updating together. The frequency display works fine but the rest of my graphs and program is frozen.
Is there some way i make everything work together? i'm assuming LABVIEW cannot display 2 different kind of measurements on my front panel from the same ai12 physical channel? I noticed that the New freq display measurement is reading as a 1D waveform and my graphs must be 2D DBL.
Or is it something to do with sampling rate? I have my graphs on continuous sampling at 120Hz. My freq display doesn't have to sample the same as long as its accurate.
Again, thank you for your help!
01-03-2008 12:56 PM
- Mark as New
- Bookmark
- Subscribe
- Mute
- Subscribe to RSS Feed
- Permalink
- Report to a Moderator
Also, the Tone Measurements VI will output only a single frequency value that you can view with a numeric indicator on the front panel. If you would like to view the graph of the frequency domain as in the example you will need to calculate the Power Spectrum using the Spectral Measurement VI and wire it to a Waveform Graph.
Chris Delvizis
National Instruments
01-04-2008 10:00 AM - edited 01-04-2008 10:02 AM
- Mark as New
- Bookmark
- Subscribe
- Mute
- Subscribe to RSS Feed
- Permalink
- Report to a Moderator
thanks for your reply. maybe i explained my situation incorrectly.
From the that sample freq program you showed me, i'm just using the numberic indicator for frequency only and not the other graphical displays (like the voltage and frequency spectrum).
In my original program, i already have a bunch of graphical displays measuring physical channel ai8 to ai12.
I wanted to see what frequency my ai12 channel as well as measure/display the voltage graphically. I believe your saying that i can't measure both frequency and graphing at the same time on 1 channel?
What i did was I connect ai12 channel to ai13 and basically copied the the sample freq measure vi program to my original program to indicate frequency.
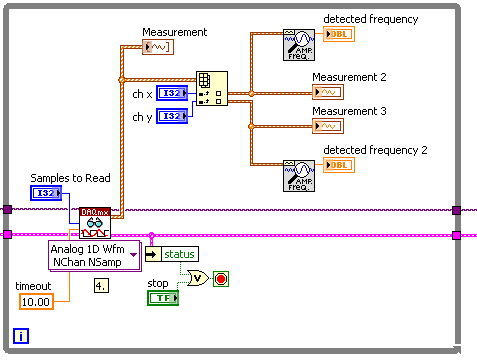
my orignal program has set the DAQmx reading ai8:ai12 to a analog 2D DBL multiple sampling.
but i noticed that the sample frequency measure program requires the DAXmx read.vi set to 1D waveform to measure frequency not 2D DBL like the rest of my program. I think it is where this part i'm having problems with sampling all my inputs ai8 to ai13.
so when i copied the sample frequency measure program into my original program, it only runs one physical channel. Only the sample frequency program (ai13) or my other ai8 to ai12 graphs will work but not both at the same time. It can't do all ai8:ai12 2D including the ai13 1D measurement continuously.
i dont think its possible to read in analog 1D and 2D measurements at the same time?
Thanks again.
Message Edited by immortalc on 01-04-2008 10:02 AM
01-04-2008 11:15 AM - edited 01-04-2008 11:16 AM
- Mark as New
- Bookmark
- Subscribe
- Mute
- Subscribe to RSS Feed
- Permalink
- Report to a Moderator
Message Edited by Dennis Knutson on 01-04-2008 10:16 AM
01-04-2008 11:59 AM
- Mark as New
- Bookmark
- Subscribe
- Mute
- Subscribe to RSS Feed
- Permalink
- Report to a Moderator
01-04-2008 12:42 PM
- Mark as New
- Bookmark
- Subscribe
- Mute
- Subscribe to RSS Feed
- Permalink
- Report to a Moderator
Why must you use 2D DBL? Can you explain in detail?
In any case, you can convert from a waveform to an array. A waveform datatype is a cluster that includes t0, dt, and a Y array. To get the Y array, you can use the Get Waveform Components function. This is on the waveform palette and works just like an unbundle by name. Once you've gotten more than a single 1D array from mulitple waveforms, you can create a 2D array with the Build Array function.
