- Subscribe to RSS Feed
- Mark Topic as New
- Mark Topic as Read
- Float this Topic for Current User
- Bookmark
- Subscribe
- Mute
- Printer Friendly Page
Historical Plots by realtime
02-07-2007 02:19 PM
- Mark as New
- Bookmark
- Subscribe
- Mute
- Subscribe to RSS Feed
- Permalink
- Report to a Moderator
02-07-2007 03:08 PM - edited 02-07-2007 03:08 PM
- Mark as New
- Bookmark
- Subscribe
- Mute
- Subscribe to RSS Feed
- Permalink
- Report to a Moderator
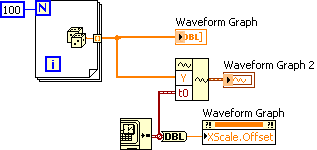
A chart or graph does not go off and read the current time. The start time is something that you have to provide to the chart/graph. If you are using a DAQ board for the acquisition, you should be using a waveform data type as that contains a timestamp. If you are not using a DAQ board and just have a y array, you can create a waveform data type with the Build Waveform function and wire the Get Date/Time in Seconds to the t0 input. When you use a waveform data type, make sure you right click on the graph and uncheck 'Ignore Time Stamp'. The other way is to get the current time and wire that to the Xscale.Offset property of the chart/graph.
Message Edited by Dennis Knutson on 02-07-2007 02:09 PM
02-07-2007 04:20 PM
- Mark as New
- Bookmark
- Subscribe
- Mute
- Subscribe to RSS Feed
- Permalink
- Report to a Moderator
