Turn on suggestions
Auto-suggest helps you quickly narrow down your search results by suggesting possible matches as you type.
Showing results for
Topic Options
- Subscribe to RSS Feed
- Mark Topic as New
- Mark Topic as Read
- Float this Topic for Current User
- Bookmark
- Subscribe
- Mute
- Printer Friendly Page
- « Previous
-
- 1
- 2
- Next »
How to plot whole history data on a XY-graph if the data size is too big.
Trusted Enthusiast
05-07-2008 02:36 AM
Options
- Mark as New
- Bookmark
- Subscribe
- Mute
- Subscribe to RSS Feed
- Permalink
- Report to a Moderator
appforce wrote:Is there any way to get a chunk of data and plot these data first and then get another chunk of data, plot the data, and still hold the previous data on the plot?
If you want to hold the history data for a plot, you have to use the Waveform Chart instead of the Waveform Graph, because the former has the property called History Data while the latter does not. 
Hope it helps...
- Partha ( CLD until Oct 2027 🙂 )
Knight of NI
05-07-2008 02:10 PM - edited 05-07-2008 02:11 PM
Options
- Mark as New
- Bookmark
- Subscribe
- Mute
- Subscribe to RSS Feed
- Permalink
- Report to a Moderator
appforce wrote:
Here is the VI.
You have to be kidding! You have a huge file and...
- read it line by line in a while loop
- monitoring file positions
- with each iteration converting two data points to a 2D array (!!)
- followed by indexing out the two values with two seperate index nodes
- form an xy cluster
- built a cluster array at the loop boundary
- bundle the array
- make the cluster into an array with one huge element
- feed it to a 2D graph.
- Surround everything with a useless sequence frame!
Point 7 and 8 are completely useless, you can wire the output from the indexing node direclty to the graph terminal. Try it!
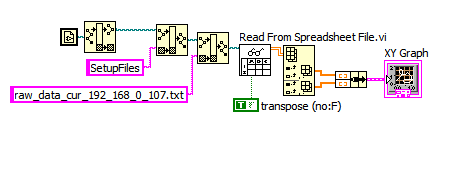
There is a primitive to read such files in one step.
The following code does exactly the same
Message Edited by altenbach on 05-07-2008 12:11 PM
Download All
Virus scan in progress. Please wait to download attachments.
05-07-2008 04:25 PM
Options
- Mark as New
- Bookmark
- Subscribe
- Mute
- Subscribe to RSS Feed
- Permalink
- Report to a Moderator
Hello,
Thank you very much. It makes my program running much faster than it did.
Best Regards,
Benjamin Chu
Thank you very much. It makes my program running much faster than it did.
Best Regards,
Benjamin Chu
- « Previous
-
- 1
- 2
- Next »
