- Subscribe to RSS Feed
- Mark Topic as New
- Mark Topic as Read
- Float this Topic for Current User
- Bookmark
- Subscribe
- Mute
- Printer Friendly Page
I want to make the parts of a white waveform graph line that are above a cursor red
09-06-2006 12:24 PM
- Mark as New
- Bookmark
- Subscribe
- Mute
- Subscribe to RSS Feed
- Permalink
- Report to a Moderator
09-06-2006 01:54 PM - edited 09-06-2006 01:54 PM
- Mark as New
- Bookmark
- Subscribe
- Mute
- Subscribe to RSS Feed
- Permalink
- Report to a Moderator
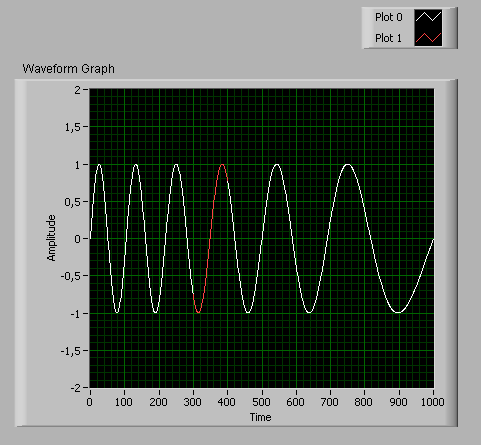
if you plot curves with "NaN"- Values, they won't be plotted. So you have to feed two plots with the same values to the Graph and replace the area of interest with NaN.
See example below (I have LV 7.1, so I can't save the VI down to 6.1).

Greets, Dave
Message Edited by daveTW on 09-06-2006 08:57 PM
09-06-2006 02:00 PM - edited 09-06-2006 02:00 PM
- Mark as New
- Bookmark
- Subscribe
- Mute
- Subscribe to RSS Feed
- Permalink
- Report to a Moderator
@BobChuck wrote:I want to make the parts of a white waveform graph line that are above a cursor red. It's hard to do; I know it involves some sort of invisible chart beneath the graph. I've searched everywhere (including here) for walkthroughs or code examples, but I have LabVIEW 6.1 so I can't view most of what's out there.
Make a copy of the waveform and replace all values less than the cursor y value by 'NaN' values. Arrange this copy on top of the original waveform curve and give it a red color. The NaN values of the copy are not displayed.
-Franz
(I was obviously not quick enough to answer the question...)
Message Edited by ahlers01 on 09-06-2006 02:01 PM
09-06-2006 03:50 PM
- Mark as New
- Bookmark
- Subscribe
- Mute
- Subscribe to RSS Feed
- Permalink
- Report to a Moderator
09-06-2006 04:18 PM
- Mark as New
- Bookmark
- Subscribe
- Mute
- Subscribe to RSS Feed
- Permalink
- Report to a Moderator
Sorry, but what do you mean with 'multiple times' and 'live-feed'?
@BobChuck wrote:Is there a way to do this multiple times while still using only two lines?Is there a way to do this with a live-feed?
09-07-2006 09:01 AM
- Mark as New
- Bookmark
- Subscribe
- Mute
- Subscribe to RSS Feed
- Permalink
- Report to a Moderator
09-08-2006 07:26 AM
- Mark as New
- Bookmark
- Subscribe
- Mute
- Subscribe to RSS Feed
- Permalink
- Report to a Moderator
09-11-2006 03:05 AM - edited 09-11-2006 03:05 AM
- Mark as New
- Bookmark
- Subscribe
- Mute
- Subscribe to RSS Feed
- Permalink
- Report to a Moderator
this is very similar to my example above, it only walks with a for- loop through the data and asks whether it's in the limit or not.


Greets, Dave
Message Edited by daveTW on 09-11-2006 10:06 AM
