- Subscribe to RSS Feed
- Mark Topic as New
- Mark Topic as Read
- Float this Topic for Current User
- Bookmark
- Subscribe
- Mute
- Printer Friendly Page
I would like to know how i can create a bell graph with out using sub VIs, the data that i created consists in 500 readings with values of 0 to 100, i calculated the mean value and standard diviation. I hope some one can help me
12-01-2006 11:53 AM
- Mark as New
- Bookmark
- Subscribe
- Mute
- Subscribe to RSS Feed
- Permalink
- Report to a Moderator
12-01-2006 12:03 PM
- Mark as New
- Bookmark
- Subscribe
- Mute
- Subscribe to RSS Feed
- Permalink
- Report to a Moderator
12-01-2006 12:10 PM
- Mark as New
- Bookmark
- Subscribe
- Mute
- Subscribe to RSS Feed
- Permalink
- Report to a Moderator
12-01-2006 12:13 PM
- Mark as New
- Bookmark
- Subscribe
- Mute
- Subscribe to RSS Feed
- Permalink
- Report to a Moderator
12-01-2006 12:25 PM
- Mark as New
- Bookmark
- Subscribe
- Mute
- Subscribe to RSS Feed
- Permalink
- Report to a Moderator
For limited-range data, it isn't hard to do your own histogram binning. For example:
1. Initialize a 0-valued array of size 101 (indices 0-100) and send it into a For Loop's shift register.
2. Auto-index the For Loop with your array of 500 readings.
3. Each loop iteration, use the reading value 0-100 as an array index.
4. Increment the value at that index and stuff the new value back in using "Replace Array Subset." Pass this into the right-side shift register.
5. When the loop completes, your counts have been binned in the shift register array. Array(i) = (# readings equal to i). Plot it.
6. Adjust as needed. Here you're spreading 500 samples over 101 bins. That may be a bit too coarse. Maybe you should make an array with indices from 0-25 which bins the result of (reading value / 4). You get the idea, right?
-Kevin P.
12-01-2006 12:35 PM
- Mark as New
- Bookmark
- Subscribe
- Mute
- Subscribe to RSS Feed
- Permalink
- Report to a Moderator
12-01-2006 12:38 PM
- Mark as New
- Bookmark
- Subscribe
- Mute
- Subscribe to RSS Feed
- Permalink
- Report to a Moderator
12-01-2006 01:41 PM - edited 12-01-2006 01:41 PM
- Mark as New
- Bookmark
- Subscribe
- Mute
- Subscribe to RSS Feed
- Permalink
- Report to a Moderator
Here's a quick example I threw together that generates a sort-of-bell-curve shaped data distribution, then performs the binning and plotting.
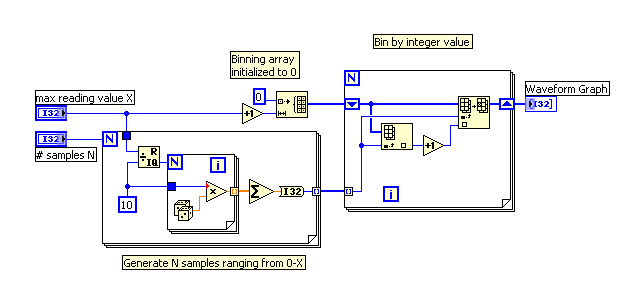
-Kevin P.
Message Edited by Kevin Price on 12-01-2006 02:42 PM
