Turn on suggestions
Auto-suggest helps you quickly narrow down your search results by suggesting possible matches as you type.
Showing results for
Topic Options
- Subscribe to RSS Feed
- Mark Topic as New
- Mark Topic as Read
- Float this Topic for Current User
- Bookmark
- Subscribe
- Mute
- Printer Friendly Page
- « Previous
-
- 1
- 2
- Next »
Memory full
Knight of NI
11-23-2007 01:18 AM
Options
- Mark as New
- Bookmark
- Subscribe
- Mute
- Subscribe to RSS Feed
- Permalink
- Report to a Moderator
turbot wrote:
The collect vi looks good, but seems only can process one dimension data, for 2 dimension data, need to use split and build up array again.
No, it can also deal with 2D arrays.
I'll have a look at your VI using the data constant, probably over the weekend.
Is that lower graph your xy history plot with 60000 points? You should definitely use a simple plot style (e.g. lines or single pixel points instead of fancy points).
Knight of NI
11-23-2007 01:21 PM - edited 11-23-2007 01:22 PM
Options
- Mark as New
- Bookmark
- Subscribe
- Mute
- Subscribe to RSS Feed
- Permalink
- Report to a Moderator
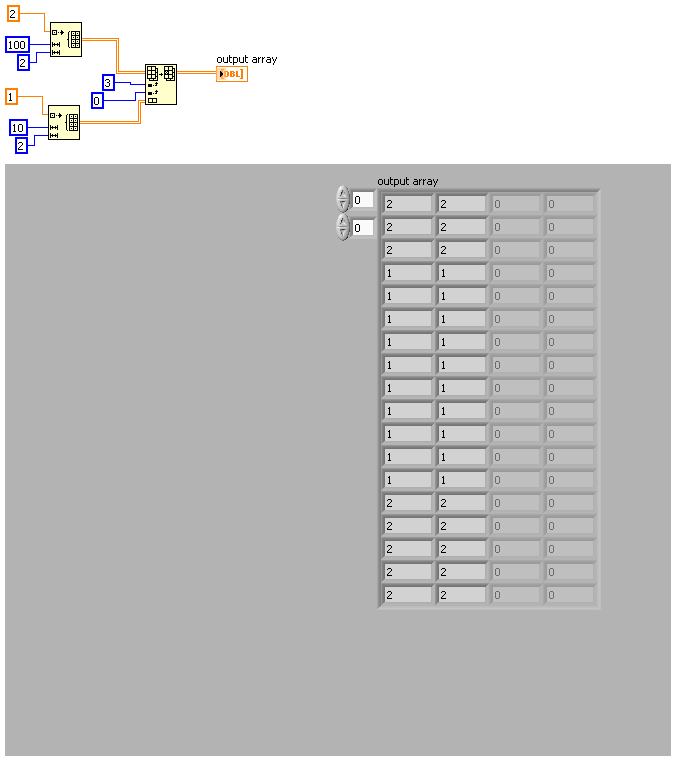
Here is how to replace larger chunks. On the left I created 2 arrays. 100 rows by 2 columns of the number 2 and 10 rows by 2 columns of the number 1. I placed the smaller one into the larger starting at row 3 using the replace array subset function.
Message Edited by Ravens Fan on 11-23-2007 02:22 PM
- « Previous
-
- 1
- 2
- Next »
