- Subscribe to RSS Feed
- Mark Topic as New
- Mark Topic as Read
- Float this Topic for Current User
- Bookmark
- Subscribe
- Mute
- Printer Friendly Page
Missing data in 3D surface plot.
01-15-2010 04:05 PM
- Mark as New
- Bookmark
- Subscribe
- Mute
- Subscribe to RSS Feed
- Permalink
- Report to a Moderator
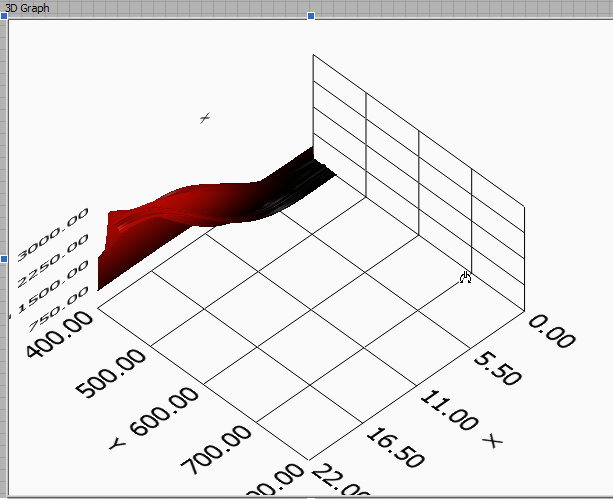
Got an easy one for someone to solve. I've created a 3D plot, but the plot doesn't show all of the data.
I'm reading data from a set of .txt files and trying to visualize the results via the 3D plot. Each txt file contains a set of 401 data pairs (y location, measurement). A scalar (x location) is assigned to each file set, then added to an array containing data from previously read files. The resulting array is parsed, rearranged, etc. before going to the 3D Surface Plot control. Looks goofy because this .vi was originally used to combine data from multiple .txt files into a single file.
As you can see from the screen shot, the 3D plot only shows data from 400 to 445 (input data goes to 800). I checked the plot input arrays/matrices to ensure all of the data was read from the .txt files (it's all in there). What am I missing?
The .vi is attached along with a sample .txt file.
01-15-2010 05:55 PM
- Mark as New
- Bookmark
- Subscribe
- Mute
- Subscribe to RSS Feed
- Permalink
- Report to a Moderator
You might want to transpose the z array so the dimension better match the x and y array sizes. Also eliminate the zero at the end of the y array.
Delete the first column from the z-matrix, it seems to duplicate the y array.
Your data and array gymnastics are incomprehensible and way too complicated. Can you tell how you want to read the input file in some simple words?
01-18-2010 10:02 AM
- Mark as New
- Bookmark
- Subscribe
- Mute
- Subscribe to RSS Feed
- Permalink
- Report to a Moderator
Thanks for catching the zero value and the duplicate y-array in the z matrix.
In regards to the inconmprehensible array & data handling, as I said, it's goofy. Wouldn't have done it this way if built from scratch.
Anyway...
Transposing the z-matrix solved the problem. Thanks altenbach.

