- Subscribe to RSS Feed
- Mark Topic as New
- Mark Topic as Read
- Float this Topic for Current User
- Bookmark
- Subscribe
- Mute
- Printer Friendly Page
Plot 3dsurface Line and X,Y,Z Axis ....
12-24-2007 07:29 AM
- Mark as New
- Bookmark
- Subscribe
- Mute
- Subscribe to RSS Feed
- Permalink
- Report to a Moderator
Set all axis to the same rnage.
Post your code AND data and we'll take a look.
Ben
12-24-2007 10:49 PM
- Mark as New
- Bookmark
- Subscribe
- Mute
- Subscribe to RSS Feed
- Permalink
- Report to a Moderator
12-28-2007 03:06 PM - edited 12-28-2007 03:08 PM
- Mark as New
- Bookmark
- Subscribe
- Mute
- Subscribe to RSS Feed
- Permalink
- Report to a Moderator
Your plot appears correct for the data you have.
What seems wrong?
Ben
Message Edited by Ben on 12-28-2007 03:07 PM
Message Edited by Ben on 12-28-2007 03:08 PM
12-31-2007 03:51 AM
- Mark as New
- Bookmark
- Subscribe
- Mute
- Subscribe to RSS Feed
- Permalink
- Report to a Moderator
12-31-2007 08:12 AM - edited 12-31-2007 08:16 AM
- Mark as New
- Bookmark
- Subscribe
- Mute
- Subscribe to RSS Feed
- Permalink
- Report to a Moderator
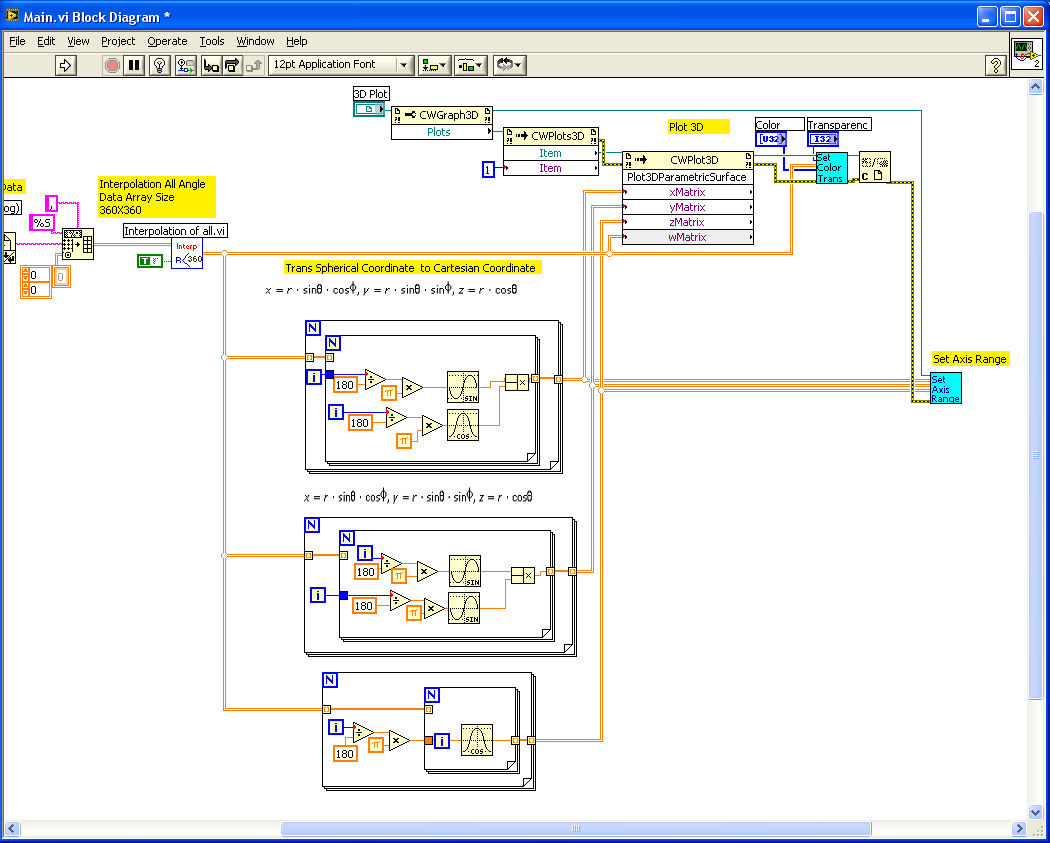
Yes your posted code works.
You version

As also shown in my modified version.
This is correct for the code as written.
You code is using your data to modulate the radius of the sphere.
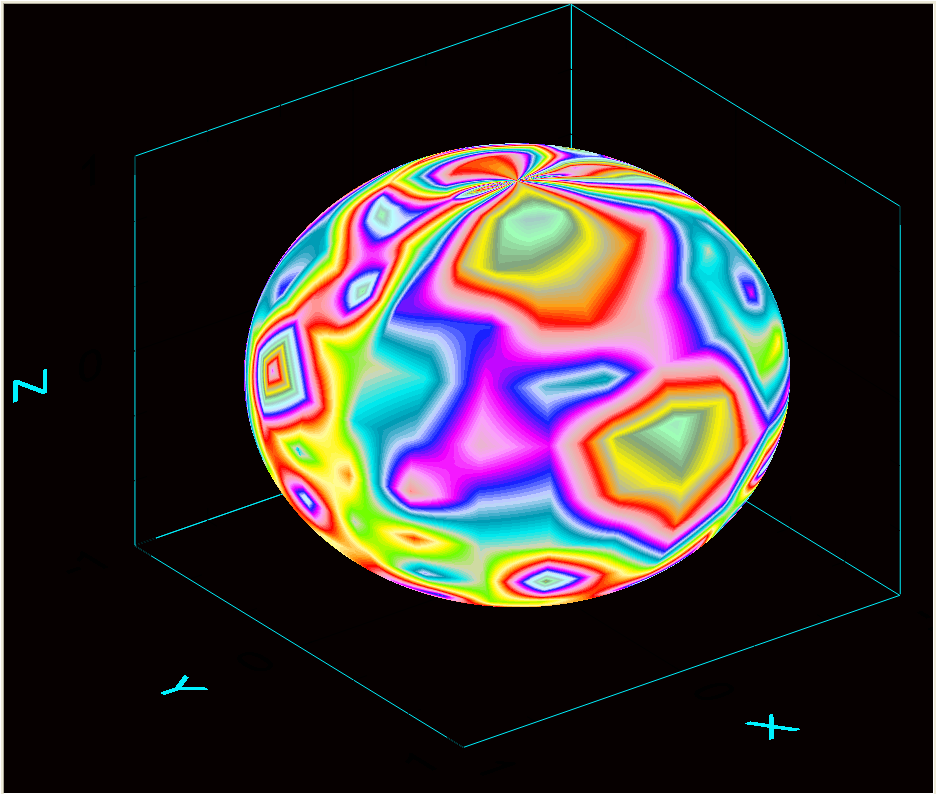
In my previous post, I eliminated the modulation of the radius and left it fixed at "1". I used you data to control the colors plotted on the surface of the sphere.
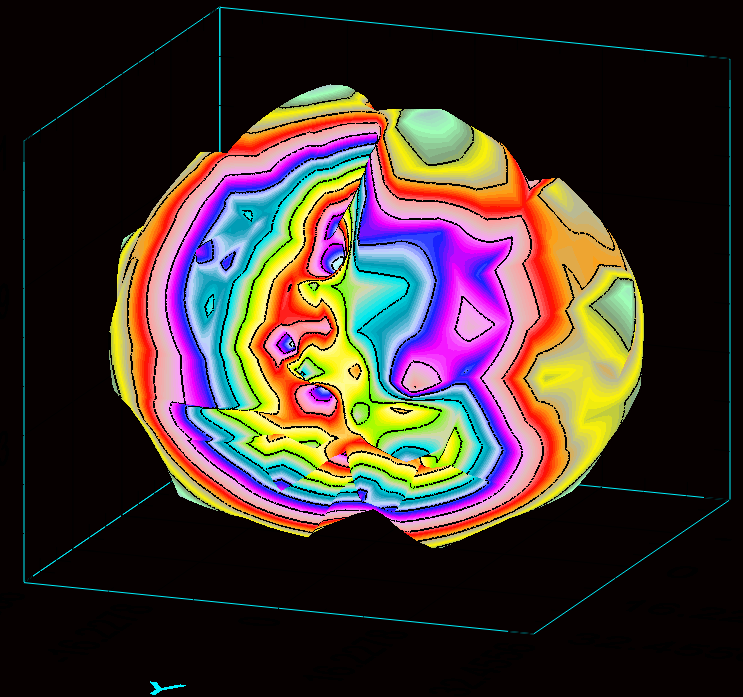
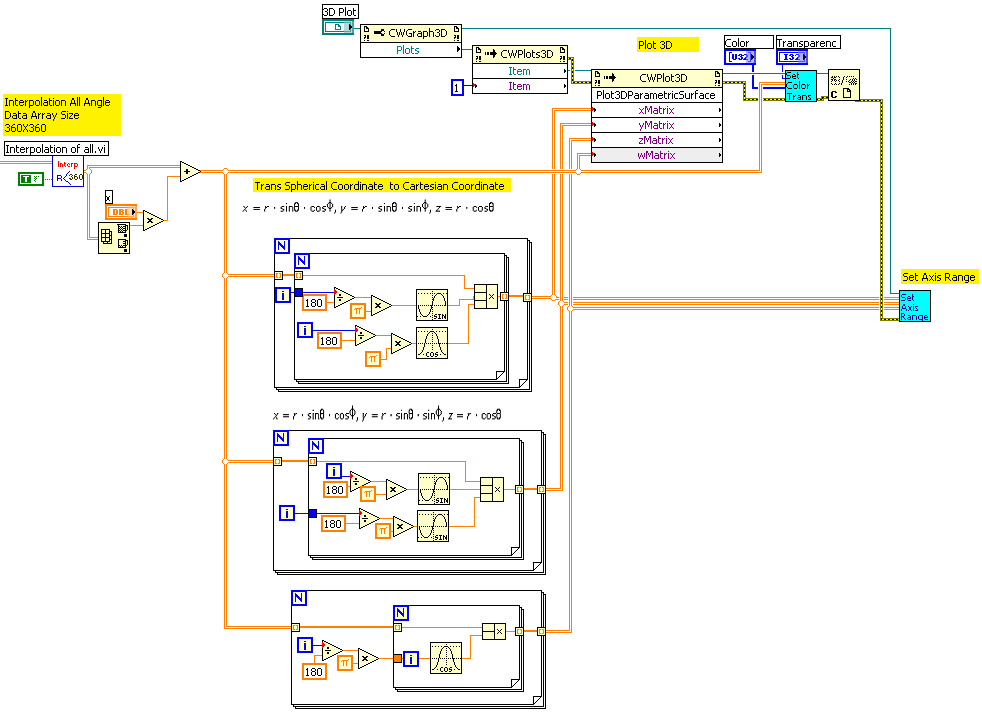
In the new version (the one that matches your plot) I have restored the modulation of the radius about a radius that was 10X the max value found in your data set while also plotting the data as a color spectrum.
Message Edited by Ben on 12-31-2007 08:13 AM
Message Edited by Ben on 12-31-2007 08:16 AM
01-01-2008 08:54 AM
- Mark as New
- Bookmark
- Subscribe
- Mute
- Subscribe to RSS Feed
- Permalink
- Report to a Moderator
01-01-2008 09:58 AM - edited 01-01-2008 10:04 AM
- Mark as New
- Bookmark
- Subscribe
- Mute
- Subscribe to RSS Feed
- Permalink
- Report to a Moderator
The other VI's can be found at this link.
Your surface line mesh is defined by your data. Your data set has much more info than your reference image.
This is my version of your code.
So what type of phenomenon are we looking at in this data set?
Curious,
Ben
Message Edited by Ben on 01-01-2008 10:03 AM
Message Edited by Ben on 01-01-2008 10:04 AM
01-01-2008 10:10 AM - edited 01-01-2008 10:11 AM
- Mark as New
- Bookmark
- Subscribe
- Mute
- Subscribe to RSS Feed
- Permalink
- Report to a Moderator
BTW the "i" in bottom nested loop is not wired! It moved when I sized the loop down and I did not notice.
Ben
Message Edited by Ben on 01-01-2008 10:11 AM
01-10-2008 03:00 AM
- Mark as New
- Bookmark
- Subscribe
- Mute
- Subscribe to RSS Feed
- Permalink
- Report to a Moderator
07-25-2008 12:17 PM
- Mark as New
- Bookmark
- Subscribe
- Mute
- Subscribe to RSS Feed
- Permalink
- Report to a Moderator
