- Subscribe to RSS Feed
- Mark Topic as New
- Mark Topic as Read
- Float this Topic for Current User
- Bookmark
- Subscribe
- Mute
- Printer Friendly Page
Trying to fit a cosine function to measured data...
04-17-2008 10:34 AM
- Mark as New
- Bookmark
- Subscribe
- Mute
- Subscribe to RSS Feed
- Permalink
- Report to a Moderator
04-17-2008 11:35 AM
- Mark as New
- Bookmark
- Subscribe
- Mute
- Subscribe to RSS Feed
- Permalink
- Report to a Moderator
One thing I have learned is that fitting to sine or cosine functions does not work well if you have multiple cycles of the waveform in the data. It appears that the methods used do not change frequencies very well. Even if the initial estimate of frequency is very close, sometimes it does not work. It does seem to work fairly well for fractions of a cycle as shown in your example.
This is something I have been working on (at a low level of effort) for a couple of years. Unfortunately, I cannot offer any good suggestions yet.
Lynn
04-17-2008 12:13 PM - edited 04-17-2008 12:16 PM
- Mark as New
- Bookmark
- Subscribe
- Mute
- Subscribe to RSS Feed
- Permalink
- Report to a Moderator
Periodic functions can be very hard to fit if your guesses are wrong, because you can equally well fit to an alias frequency or a phase shifts corresponding to an integer multiple of the wavelength.
Anyway, If your initial estimates are reasonable, you should have no problem. In your case, just graph also the function calculated with the initial estimate and you can see that it is almost inverted (A1=-01, vs. A1=0.1, different sign!). Here's it can roll either way or go off into the woods. You can even interactively adjust the guesses until things look similar before fitting.
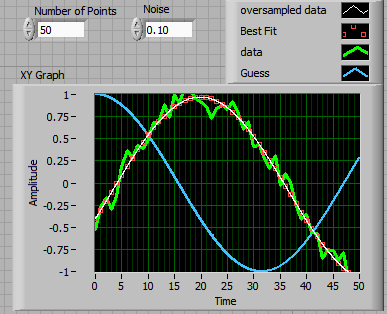
If your data typilcally looks similar (less than one full wave, one frequency, etc.) you should calculate the initial estimates from features in the data (average Y, max(y), min(y), x(max Y), x(min(y), etc.) Now things will be much more robust!
To make sure we're not dealing with an alias frequency, I also typically graph the final function calculated with much denser x-values and use an xy graph.
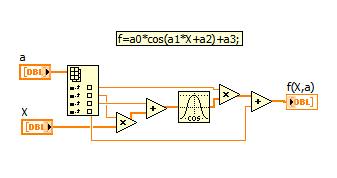
You might also use wires for the function as follows. Looks nice and is easier to debug.
Message Edited by altenbach on 04-17-2008 10:16 AM
04-18-2008 02:34 PM
- Mark as New
- Bookmark
- Subscribe
- Mute
- Subscribe to RSS Feed
- Permalink
- Report to a Moderator
-Jim
04-18-2008 03:14 PM
- Mark as New
- Bookmark
- Subscribe
- Mute
- Subscribe to RSS Feed
- Permalink
- Report to a Moderator
DSPGuy wrote:
A reasonable starting point can be usually be found using the Extract Single Tone information.vi, and Basic Averaged DC-RMS.vi.
04-20-2008 11:50 AM
- Mark as New
- Bookmark
- Subscribe
- Mute
- Subscribe to RSS Feed
- Permalink
- Report to a Moderator
I'll explain a little more what I'm doing... basically, I'm measuring the back reflection from an optical interferometer as a function of the light wavelength. As the interferometer is low finesse, the reflectivity varies as a cosine. I need to find the period of said cosine in order to calculate the thickness of the interferometer. It's highly possible that there will be less than one full period of cosine, or at least, there will likely be no more than one full period. Hence I stayed away from the "single tone information" approach
What I've done so far is to put the fitting code into a loop which displays the fit result and allows me to manually update the initial parameters until I get a fit... The data ought to be pretty "clean" in terms of noise so I'm hoping I can just give good enough initial values and progressively improve the fit by hand. I've set up the code to calculate A0 and A3 (the first and last fit parameters) based on the measured amplitude and offset of the cosine, so that should help (although if there's less than a full period, that may not work well... i'll just have to see I guess...
Anyways, thanks again for all the replies...
Paul
04-21-2008 08:40 AM
- Mark as New
- Bookmark
- Subscribe
- Mute
- Subscribe to RSS Feed
- Permalink
- Report to a Moderator
If you have two zero crossings you can get a pretty good estimate of the frequency from that. Similarly, the locations of the zero crossings in the dataset can give an estimate for the phase. Since you will be evaluating the fit manually, the time it would take the software to calculate these estimates would be insignificant.
Lynn
04-21-2008 10:52 AM
- Mark as New
- Bookmark
- Subscribe
- Mute
- Subscribe to RSS Feed
- Permalink
- Report to a Moderator
johnsold wrote:
If you have two zero crossings you can get a pretty good estimate of the frequency from that.
04-21-2008 11:30 AM
- Mark as New
- Bookmark
- Subscribe
- Mute
- Subscribe to RSS Feed
- Permalink
- Report to a Moderator
Lynn
