- Subscribe to RSS Feed
- Mark Topic as New
- Mark Topic as Read
- Float this Topic for Current User
- Bookmark
- Subscribe
- Mute
- Printer Friendly Page
Trying to get multiple colours in an xy plot
02-16-2007 11:06 AM
- Mark as New
- Bookmark
- Subscribe
- Mute
- Subscribe to RSS Feed
- Permalink
- Report to a Moderator
Using Labview 7 Express
02-16-2007 11:29 AM
- Mark as New
- Bookmark
- Subscribe
- Mute
- Subscribe to RSS Feed
- Permalink
- Report to a Moderator
02-16-2007 11:43 AM
- Mark as New
- Bookmark
- Subscribe
- Mute
- Subscribe to RSS Feed
- Permalink
- Report to a Moderator
Using Labview 7 Express
02-16-2007 11:59 AM - edited 02-16-2007 11:59 AM
- Mark as New
- Bookmark
- Subscribe
- Mute
- Subscribe to RSS Feed
- Permalink
- Report to a Moderator
For a a scatter plot, you don't even need the NaNs.
Simply feed the x and y arrays into a loop as above and built new array pairs depending on the boolean. Here is one possibility:

I am not sure if LabVIEW 7.0 has annotation capability. How many points do you have?
Message Edited by altenbach on 02-16-2007 10:01 AM
02-16-2007 12:07 PM
- Mark as New
- Bookmark
- Subscribe
- Mute
- Subscribe to RSS Feed
- Permalink
- Report to a Moderator
Using Labview 7 Express
02-16-2007 12:12 PM
- Mark as New
- Bookmark
- Subscribe
- Mute
- Subscribe to RSS Feed
- Permalink
- Report to a Moderator
02-16-2007 12:22 PM
- Mark as New
- Bookmark
- Subscribe
- Mute
- Subscribe to RSS Feed
- Permalink
- Report to a Moderator
Using Labview 7 Express
02-16-2007 12:31 PM
- Mark as New
- Bookmark
- Subscribe
- Mute
- Subscribe to RSS Feed
- Permalink
- Report to a Moderator
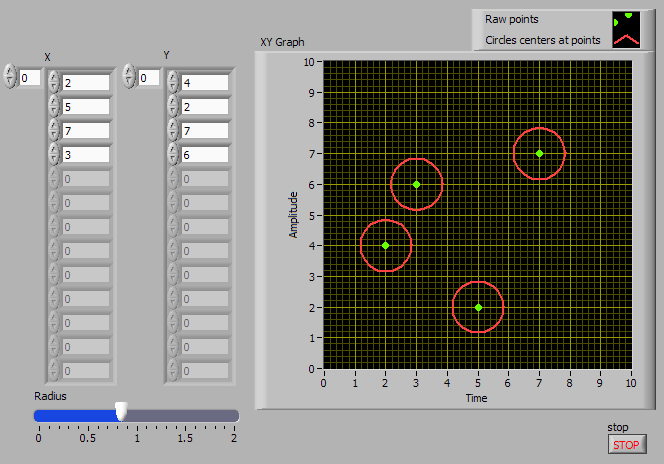
You can change the point style to open circles. You can make them bigger by increasing the "linewidth" (a bit unintuitive, since you don't even show lines ;))
Annotations have been made much easier in newer version. For example we can even draw arbitrary things on the graph area using image commands.
One possibility for you would be to use an picture indicator instead of an xy graph. Here you have full control over anything at the cost of a bit more coding.
02-16-2007 12:58 PM
- Mark as New
- Bookmark
- Subscribe
- Mute
- Subscribe to RSS Feed
- Permalink
- Report to a Moderator
Using Labview 7 Express
02-16-2007 02:54 PM - edited 02-16-2007 02:54 PM
- Mark as New
- Bookmark
- Subscribe
- Mute
- Subscribe to RSS Feed
- Permalink
- Report to a Moderator

I tend to use complex numbers for simplicity for 2D geometry. Newer LabVIEW versions can graph complex data as xy on an xy graph, making things even easier.
Message Edited by altenbach on 02-16-2007 12:57 PM
