- Subscribe to RSS Feed
- Mark Topic as New
- Mark Topic as Read
- Float this Topic for Current User
- Bookmark
- Subscribe
- Mute
- Printer Friendly Page
Using controls to change range of multiple graphs
04-20-2008 02:48 AM
- Mark as New
- Bookmark
- Subscribe
- Mute
- Subscribe to RSS Feed
- Permalink
- Report to a Moderator
I have two questions:
I have a VI with ten graphs created from a ASCII file loaded by read spreadsheet function. The first graphs shows the points 1 until 200 of X axis, the second graph the points 201 until 400 of X axis, the third graphs the points 401 until 600 of X axis........ until the end of points....
All these graphs present the same range in the Y axis
First question: is there a way to change the size of the invertals of X axis (that is 200 points in the example above), using a control? Because are many graphs, and changing the ranges one by one will be not fast...
Second question: is there a way to change the range of Y axis in all the graphs in one operation, using a control?
Thanks
Daniel
04-20-2008 03:12 AM
- Mark as New
- Bookmark
- Subscribe
- Mute
- Subscribe to RSS Feed
- Permalink
- Report to a Moderator
04-20-2008 03:21 AM
- Mark as New
- Bookmark
- Subscribe
- Mute
- Subscribe to RSS Feed
- Permalink
- Report to a Moderator
04-20-2008 03:55 AM
- Mark as New
- Bookmark
- Subscribe
- Mute
- Subscribe to RSS Feed
- Permalink
- Report to a Moderator
I was not able to open the files... my Labview is older than yours....
I use 10 graphs because I need to perform a visual inspect of the segments of the whole series. Next, I can remove some segments that present artefacts and these segments will not affect the average of the whole series.
Thanks
Daniel
04-20-2008 12:39 PM - edited 04-20-2008 12:40 PM
- Mark as New
- Bookmark
- Subscribe
- Mute
- Subscribe to RSS Feed
- Permalink
- Report to a Moderator
What is your version?
daniel.penteado wrote:
I was not able to open the files... my Labview is older than yours....
Still, I doubt you need 10 different graphs. You could use a single graph, show the scroll bar, and let the user define the rangeboundary to be removed using cursors for example. You could also use a single graph and a suitable control to pick which range to show at any given point in time.
daniel.penteado wrote:
I use 10 graphs because I need to perform a visual inspect of the segments of the whole series. Next, I can remove some segments that present artefacts and these segments will not affect the average of the whole series.
Message Edited by altenbach on 04-20-2008 10:40 AM
04-20-2008 02:13 PM - edited 04-20-2008 02:14 PM
- Mark as New
- Bookmark
- Subscribe
- Mute
- Subscribe to RSS Feed
- Permalink
- Report to a Moderator
I was looking at the examples of Labview and I think that my problem is solved. I am sending a VI attached with the control for the ranges, as I want. But I still have a problem... I want to change this VI to create my graph from a ASCII file loaded by spreadsheet read function...but I am not able to do this... When I wire the read spreadsheet to the "waveform data" terminal in the Plot Waveform VI, I got an error and I try to manage this error inserting arrays and build arrays between the read spreadsheet function and the Plot Waveform, but I was unsuccessful.... If I connect properly the read spreadsheet to the Plot Waveform my problem is solved....
Your idea in the image posted is very good, and is a good alternative to plot large series.... but in this particular case I need the multiple graphs...
Thanks for attention...
Daniel
Message Edited by daniel.penteado on 04-20-2008 02:14 PM
04-21-2008 11:29 AM
- Mark as New
- Bookmark
- Subscribe
- Mute
- Subscribe to RSS Feed
- Permalink
- Report to a Moderator
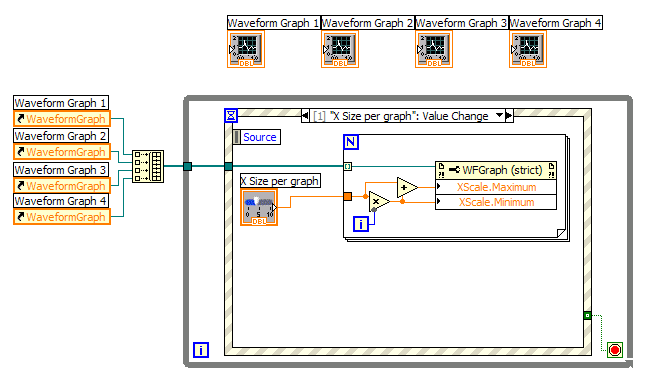
Altenbach's posted code does handle multiple graphs. It has 4 Waveform graphs numbered 1 through 4. It uses control references and property nodes to iterate over the 4 graphs in a loop.
daniel.penteado wrote:
Your idea in the image posted is very good, and is a good alternative to plot large series.... but in this particular case I need the multiple graphs...
04-23-2008 09:19 PM
- Mark as New
- Bookmark
- Subscribe
- Mute
- Subscribe to RSS Feed
- Permalink
- Report to a Moderator
I was looking at the examples of Labview and I think that my problem is solved. I am sending a VI attached with the control for the ranges, as I want. But I still have a problem... I want to change this VI to create my graph from a ASCII file loaded by spreadsheet read function...but I am not able to do this... When I wire the read spreadsheet to the "waveform data" terminal in the Plot Waveform VI, I got an error and I try to manage this error inserting arrays and build arrays between the read spreadsheet function and the Plot Waveform, but I was unsuccessful.... If I connect properly the read spreadsheet to the Plot Waveform my problem is solved....
Thanks for attention...
Daniel
04-23-2008 09:31 PM - edited 04-23-2008 09:32 PM
- Mark as New
- Bookmark
- Subscribe
- Mute
- Subscribe to RSS Feed
- Permalink
- Report to a Moderator
Message Edited by Dennis Knutson on 04-23-2008 08:32 PM
Message Edited by Dennis Knutson on 04-23-2008 08:32 PM
04-23-2008 09:45 PM
- Mark as New
- Bookmark
- Subscribe
- Mute
- Subscribe to RSS Feed
- Permalink
- Report to a Moderator
My main problem is: I have a large ASCII file and I will create multiple graphs to view segments of this file.
Graph 1: 1 to 100 (seconds) in X scale
Graph 2: 101 to 200 (seconds) in X scale
Graph 3: 201 to 300 (seconds) in X scale
and until the end of the ascii file......
I want to create a control to change the interval of each graph. In my example the inverval has 100 points (from 1 until 100, from 101 until 200), but in some situations I need to change this interval to 250 points for example. In this new situation my graph 1 will go from 1 until 250, my graph 2 will go from 251 until 500.....
But change one by one the graphs will take a long time, I need a control to change wall the graphs with one command, but I don't know how to build.
Thanks
Daniel
