- Subscribe to RSS Feed
- Mark Topic as New
- Mark Topic as Read
- Float this Topic for Current User
- Bookmark
- Subscribe
- Mute
- Printer Friendly Page
graph XY with Labview 6
10-31-2006 11:15 AM
- Mark as New
- Bookmark
- Subscribe
- Mute
- Subscribe to RSS Feed
- Permalink
- Report to a Moderator
10-31-2006 11:31 AM
- Mark as New
- Bookmark
- Subscribe
- Mute
- Subscribe to RSS Feed
- Permalink
- Report to a Moderator
10-31-2006 11:36 AM
- Mark as New
- Bookmark
- Subscribe
- Mute
- Subscribe to RSS Feed
- Permalink
- Report to a Moderator
First of all I want to thank you for your fast response.
I want to update my XY in the loop.
Here is my code.
I want to connect the 'voltage' and 'frequency' in the XY graph.
Thanks ![]()
10-31-2006 12:11 PM - edited 10-31-2006 12:11 PM
- Mark as New
- Bookmark
- Subscribe
- Mute
- Subscribe to RSS Feed
- Permalink
- Report to a Moderator
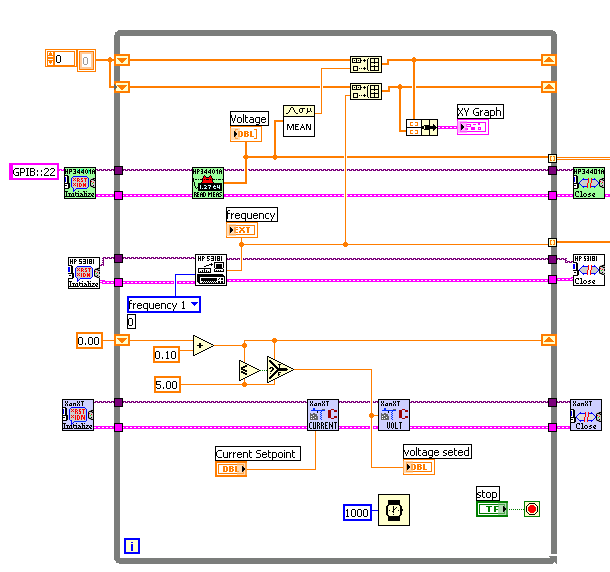
Well, your voltage is an array and your frequency is a single numeric. We need more information.
At each iteration of the loop...
- Do you want to add a single point (e.g. the first array element of the voltage vs frequency, the average voltage vs frequency, etc.)
- Do you want to add multiple points (each of the new voltages in the array vs the same frequency)?
Attachied is an image of one possible solution (graphing the average voltage vs frequency). Sorry, I no longer have LabVIEW 6.0.
As you can see, I have eliminated the stacked sequence. It is completely unecessary. It complicates the diagram, hides code, and forces backwards wires. Dataflow completely determies the correct execution order.
Growing arrays inside while loops may cause performance issues if the VI runs for extended periods of time and the arrays grow without bounds. There are many slightly more complicated variations that can address these issues. How long does the loop run. Do you need to graph all data or only e.g. the last 1000 points?

Message Edited by altenbach on 10-31-2006 10:13 AM
10-31-2006 12:27 PM
- Mark as New
- Bookmark
- Subscribe
- Mute
- Subscribe to RSS Feed
- Permalink
- Report to a Moderator
Thank you for your help,
To answer your question :
1. I want to add multiple points, that means every iteration I want to add the measured points (voltage and frequency) to my graphXY.
2. I want to add all the measured points to my graphXY.
I don't need to have an array for voltage but the driver I installed fot the HP34401 reads measurement with array.
Is that possible to change this array to a single numeric (like it is for frequency) ?
Are you sure that the Vi you modifie gonna work with Labview 6.0 ?
Thanks for helping.
10-31-2006 12:42 PM
- Mark as New
- Bookmark
- Subscribe
- Mute
- Subscribe to RSS Feed
- Permalink
- Report to a Moderator
@mysimba wrote:
Are you sure that the Vi you modifie gonna work with Labview 6.0 ?
Of course!
I took all your code and simply eliminated the sequence structure and cleand up the wire routing (no change in dataflow). The only thing I added was the upper code for the xy graph. I don't have LV6.0 so you'll have to do it on your own. Have you tried? 🙂
10-31-2006 12:45 PM
- Mark as New
- Bookmark
- Subscribe
- Mute
- Subscribe to RSS Feed
- Permalink
- Report to a Moderator
10-31-2006 12:49 PM
- Mark as New
- Bookmark
- Subscribe
- Mute
- Subscribe to RSS Feed
- Permalink
- Report to a Moderator
11-01-2006 09:16 AM
- Mark as New
- Bookmark
- Subscribe
- Mute
- Subscribe to RSS Feed
- Permalink
- Report to a Moderator
