- Subscribe to RSS Feed
- Mark Topic as New
- Mark Topic as Read
- Float this Topic for Current User
- Bookmark
- Subscribe
- Mute
- Printer Friendly Page
how to make a LVM file for a wave form
12-03-2006 08:04 PM
- Mark as New
- Bookmark
- Subscribe
- Mute
- Subscribe to RSS Feed
- Permalink
- Report to a Moderator
0
0
0
2
5
8
10
13
14
14
14
12
11
9
7
5
4
2
1
1
0
0
1
1
1
1
1
2
2
2
3
3
3
3
3
3
3
3
3
3
6
11
20
33
51
72
91
103
105
96
77
53
27
5
-11
-23
-28
-28
-23
-17
-10
-5
-1
0
1
2
1
1
1
1
0
0
0
0
0
0
0
0
0
0
0
0
1
1
2
2
3
3
4
4
5
6
7
8
8
9
10
10
11
11
12
12
12
13
14
16
18
20
22
24
27
29
31
34
37
39
42
44
47
49
52
54
55
56
57
57
58
58
57
57
56
56
54
52
50
47
43
40
36
33
29
26
23
20
17
14
12
10
8
7
5
3
2
1
1
0
0
0
0];
12-03-2006 08:34 PM - edited 12-03-2006 08:34 PM
- Mark as New
- Bookmark
- Subscribe
- Mute
- Subscribe to RSS Feed
- Permalink
- Report to a Moderator
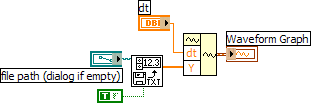
You just have to use the Read From Spreadsheet as shown below. If you put those values in a text file (without that '>>x=[' and '];' stuff, you'll get a waveform like the other picture shows. Because there is no sampling information, you will have to provide you own dt. This is pretty simple stuff. You should check out the resources for learning some of the LabVIEW basics at http://zone.ni.com/devzone/cda/tut/p/id/5054.

Message Edited by Dennis Knutson on 12-03-2006 07:38 PM
12-04-2006 07:57 PM
- Mark as New
- Bookmark
- Subscribe
- Mute
- Subscribe to RSS Feed
- Permalink
- Report to a Moderator
12-04-2006 08:46 PM
- Mark as New
- Bookmark
- Subscribe
- Mute
- Subscribe to RSS Feed
- Permalink
- Report to a Moderator
12-04-2006 11:51 PM
- Mark as New
- Bookmark
- Subscribe
- Mute
- Subscribe to RSS Feed
- Permalink
- Report to a Moderator
12-05-2006 12:06 AM
- Mark as New
- Bookmark
- Subscribe
- Mute
- Subscribe to RSS Feed
- Permalink
- Report to a Moderator
12-05-2006 08:04 AM
- Mark as New
- Bookmark
- Subscribe
- Mute
- Subscribe to RSS Feed
- Permalink
- Report to a Moderator
I can't open your VI but if you are getting a prompt for the file to load, then all you have to do is replace the path control with a constant.
It also sounds like you have gaps in the text file or in some way the data is not continuous. You could always do some sort of interpolation. Why don't you attach the text file. That I can read.
12-05-2006 03:38 PM
- Mark as New
- Bookmark
- Subscribe
- Mute
- Subscribe to RSS Feed
- Permalink
- Report to a Moderator
12-05-2006 04:00 PM - edited 12-05-2006 04:00 PM
- Mark as New
- Bookmark
- Subscribe
- Mute
- Subscribe to RSS Feed
- Permalink
- Report to a Moderator
This is what I get when I read the file. I used the same code as what I posted before except I changed the transpose input to false because I had assumed that you would have a single column in the file as the data was shown in your first post. You have a single row instead.

Message Edited by Dennis Knutson on 12-05-2006 03:01 PM
12-05-2006 06:01 PM
- Mark as New
- Bookmark
- Subscribe
- Mute
- Subscribe to RSS Feed
- Permalink
- Report to a Moderator
