- Subscribe to RSS Feed
- Mark Topic as New
- Mark Topic as Read
- Float this Topic for Current User
- Bookmark
- Subscribe
- Mute
- Printer Friendly Page
how to present characters on express table?
10-10-2007 10:05 PM
- Mark as New
- Bookmark
- Subscribe
- Mute
- Subscribe to RSS Feed
- Permalink
- Report to a Moderator
10-11-2007 03:30 AM
- Mark as New
- Bookmark
- Subscribe
- Mute
- Subscribe to RSS Feed
- Permalink
- Report to a Moderator
A table [Express/Ordinary] is a decorative form of a 2D Str array, thats it.
You can use, I mean write different representation numbers, in terms of strings in the table on the row/column of your wish.
So, try searching the array pallette for more functions like Index Array, Insert Replace & Delete array functions to do what you want.
Can you elaborate on what kind of numbers you want to write on that particular column you ve mentioned?
Please come up with some sample code & data.
10-11-2007 03:33 AM
- Mark as New
- Bookmark
- Subscribe
- Mute
- Subscribe to RSS Feed
- Permalink
- Report to a Moderator
10-11-2007 03:35 AM - edited 10-11-2007 03:35 AM
- Mark as New
- Bookmark
- Subscribe
- Mute
- Subscribe to RSS Feed
- Permalink
- Report to a Moderator
Message Edited by Stradis on 10-11-2007 04:36 AM
Paul
10-11-2007 03:55 AM
- Mark as New
- Bookmark
- Subscribe
- Mute
- Subscribe to RSS Feed
- Permalink
- Report to a Moderator
Thanks, I 've try your example. It 's OK. But I want to work with express table with the help of buid table vi. This Express VI appears on the block diagram when I place an Express table on the front panel.
10-11-2007 03:58 AM
- Mark as New
- Bookmark
- Subscribe
- Mute
- Subscribe to RSS Feed
- Permalink
- Report to a Moderator
10-11-2007 05:05 PM
- Mark as New
- Bookmark
- Subscribe
- Mute
- Subscribe to RSS Feed
- Permalink
- Report to a Moderator
What are you trying to accomplish that your code does not accomplish already? I'd be happy to help!
Americas Services and Support Recruiting Manager
National Instruments
10-11-2007 08:27 PM
- Mark as New
- Bookmark
- Subscribe
- Mute
- Subscribe to RSS Feed
- Permalink
- Report to a Moderator
I try to explain simply my work : I do statistics with my measurement files : integration, mean, standard error,..., max, min. Then I compare each integration to the mean , so it is called "good" or bad... Finally, i want to show all the result on one ex. table using build table vi: one column for integration, one column for se, one column for comparison result (good, bad)...
10-11-2007 09:45 PM - edited 10-11-2007 09:45 PM
- Mark as New
- Bookmark
- Subscribe
- Mute
- Subscribe to RSS Feed
- Permalink
- Report to a Moderator
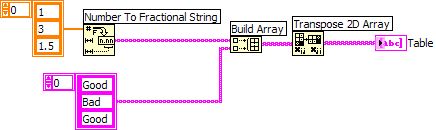
If you want the text 'Good' or 'Bad' to appear in the table, you're going to have to get rid of the Build Table Express VI. It and the dynamic data type input is not for strings. The express VI converts numeric type data into strings for display in a table. Since a table is nothing more than a 2D string indicator, all you'll have to do is convert your numeric data to strings and build the 2D string array. It's not that difficult.
Message Edited by Dennis Knutson on 10-11-2007 08:46 PM
10-11-2007 11:16 PM
- Mark as New
- Bookmark
- Subscribe
- Mute
- Subscribe to RSS Feed
- Permalink
- Report to a Moderator
