- Subscribe to RSS Feed
- Mark Topic as New
- Mark Topic as Read
- Float this Topic for Current User
- Bookmark
- Subscribe
- Mute
- Printer Friendly Page
pop-up window showing graph
01-11-2008 11:00 AM
- Mark as New
- Bookmark
- Subscribe
- Mute
- Subscribe to RSS Feed
- Permalink
- Report to a Moderator
I'm working on simulating tank-levels in a tank-system with a PID-controller.
And I was wondering if its possible to have a button that activates a pop-up window which indicates current level and setpoint for each tank?
Thanks in advance
01-14-2008 01:58 AM
- Mark as New
- Bookmark
- Subscribe
- Mute
- Subscribe to RSS Feed
- Permalink
- Report to a Moderator
Hi MrNorway!
This is definitely possible! A great example that demonstrates this is called “Dynamic Load Example” and can be found in NI Example Finder.
Regards
Øyvind Ø
01-15-2008 04:10 AM - edited 01-15-2008 04:18 AM
- Mark as New
- Bookmark
- Subscribe
- Mute
- Subscribe to RSS Feed
- Permalink
- Report to a Moderator
Thanks Øyvind!
But I have all my code in a simulation loop, so Labview will not let me place other structures inside it.. (the for-loop and case structure).
Know how to fix it? I've only used Labview for some months, so im still in a learningprocess 🙂
Regards
Bjørnar
Message Edited by MrNorway on 01-15-2008 04:18 AM
01-15-2008 07:03 AM - edited 01-15-2008 07:10 AM
- Mark as New
- Bookmark
- Subscribe
- Mute
- Subscribe to RSS Feed
- Permalink
- Report to a Moderator
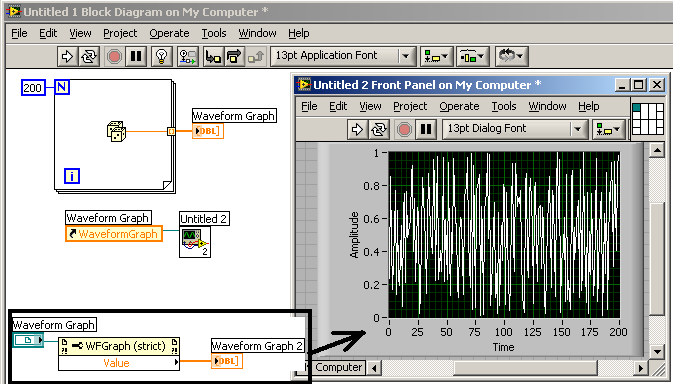
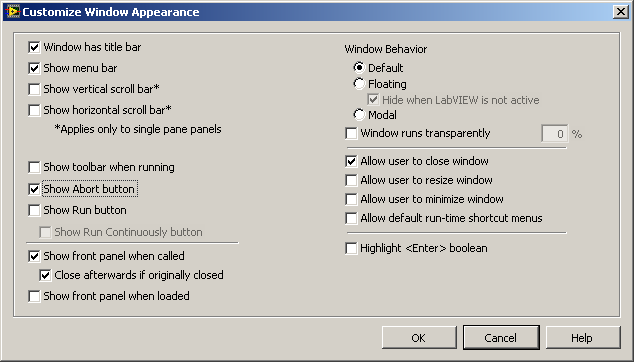
Message Edited by JoeLabView on 01-15-2008 08:10 AM
01-15-2008 10:39 AM
- Mark as New
- Bookmark
- Subscribe
- Mute
- Subscribe to RSS Feed
- Permalink
- Report to a Moderator
That helped alot! 🙂
