Turn on suggestions
Auto-suggest helps you quickly narrow down your search results by suggesting possible matches as you type.
Showing results for
Topic Options
- Subscribe to RSS Feed
- Mark Topic as New
- Mark Topic as Read
- Float this Topic for Current User
- Bookmark
- Subscribe
- Mute
- Printer Friendly Page
drawing limits lines in cwgraph
Member
06-07-2008 10:23 AM
Options
- Mark as New
- Bookmark
- Subscribe
- Mute
- Subscribe to RSS Feed
- Permalink
- Report to a Moderator
I am using VB6 with CWGraph and would like to draw/set the limit lines on the graph. How is this done? Can I modify the appearance of these lines so that they appear separate from the actual graph/chart ?
Jervin Justin
NI Employee (retired)
06-11-2008 08:27 AM - edited 06-11-2008 08:28 AM
Options
- Mark as New
- Bookmark
- Subscribe
- Mute
- Subscribe to RSS Feed
- Permalink
- Report to a Moderator
Hi hrsnblm,
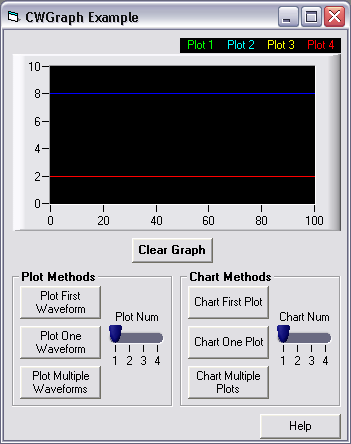
You can achieve this fairly easily using cursors.
For example, I'm working off the Simple Graph example located at:
C:\Documents and Settings\All Users\Documents\National Instruments\MStudioVS6\VB\Samples\UI\Graph\Simple Graph
What I did was:
- Right click the graph and click Properties
- Select Cursors tab
- Add two cursors (using the Add button) and change their Crosshair Style to Major Y Only
- Close out of the Properties dialog
- In the code, set the YPosition attribute of the cursor using something similar to:
CWGraph1.Cursors(1).YPosition = 8
CWGraph1.Cursors(2).YPosition = 2

Message Edited by Jervin_J on 06-11-2008 08:28 AM
Jervin Justin
NI TestStand Product Manager
NI TestStand Product Manager
06-11-2008 09:43 AM
Options
- Mark as New
- Bookmark
- Subscribe
- Mute
- Subscribe to RSS Feed
- Permalink
- Report to a Moderator
Thank you for your help. This gets me started. The limits lines I will need to draw will not be horizontal, but angled to represent the limits of a slope. Can I set the run statement "CWGraph1.Cursors(2).YPosition = " equal to the slope equation for the limit line, or is there a different way to represent such a limit line?
Thanks for your assistance.
hrsnblm
