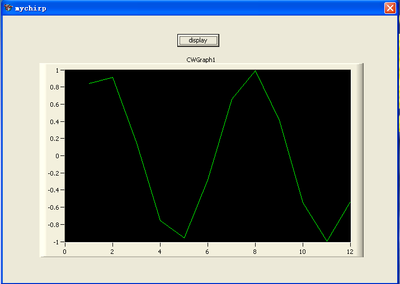
Hi, I want to use matlab and c++ to display sine curve severally. In c++ code, I use CNiGraph to display the curve, and below is the outcome:

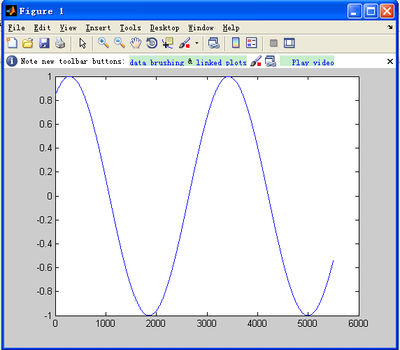
but, the real curve in matlab is:

I really want to know why. Please help me. Thanks.
c++ code:
void CmychirpDlg::OnBnClickedButton1()
{
	// TODO: 在此添加控件通知处理程序代码
	if (!libmychirpInitialize() )
		{

		}
	try
		{
			double *x=new double[5501];
			double *t=new double[5501];
			for (int i=0;i<5501;i++)
				t[i]=1+i/500;
			double f0=1;
			double t1=1;
			double f1=1;
			mwArray T(1, 5501, mxDOUBLE_CLASS);
			mwArray F0(1, 1, mxDOUBLE_CLASS);
			mwArray T1(1, 1, mxDOUBLE_CLASS);
			mwArray F1(1, 1, mxDOUBLE_CLASS);
			mwArray X(1,5501,mxDOUBLE_CLASS);
			T.SetData(t,5501);
			F0.SetData(&f0,1);
			T1.SetData(&t1,1);
			F1.SetData(&f1,1);
			mychirp(1,X,T,F0,T1,F1);
			X.GetData(x,5501);

			m_Graphmychirp.PlotXvsY(CNiReal64Vector(5501,t),CNiReal64Matrix(1,5501,x));
			delete []x;
			x=NULL;
			delete []t;
			t=NULL;

		 }//try;

		catch(const mwException& e)
		{
			MessageBox(e.what());
		}

		catch(...)
		{
			MessageBox("Unexpected error thrown");
		}

}