- Subscribe to RSS Feed
- Mark Topic as New
- Mark Topic as Read
- Float this Topic for Current User
- Bookmark
- Subscribe
- Mute
- Printer Friendly Page
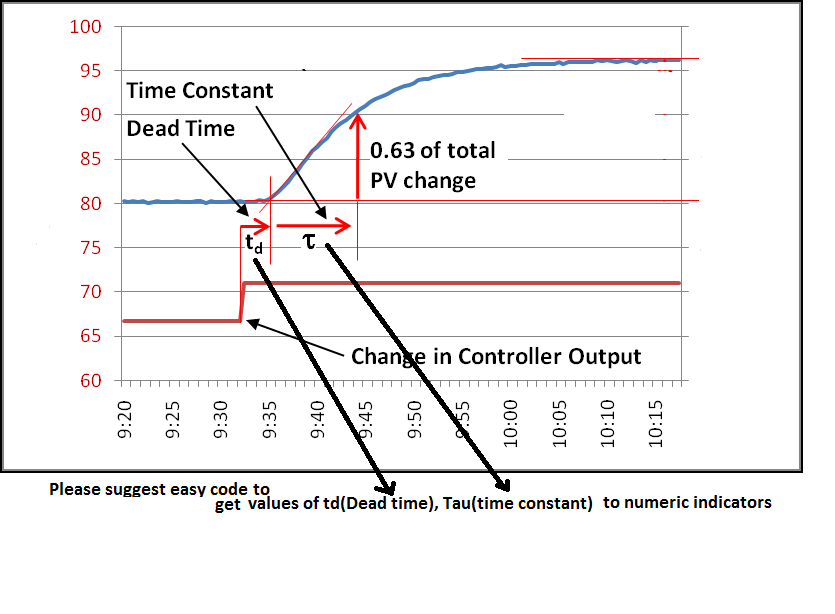
Please suggest code to find the time period of the process as shown in image.
07-28-2014 04:02 PM
- Mark as New
- Bookmark
- Subscribe
- Mute
- Subscribe to RSS Feed
- Permalink
- Report to a Moderator
Please suggest code to find the time period of the process as shown in image.
or any example from which i can have idea.
Regards
MMS79
mms79
07-29-2014
08:01 AM
- last edited on
06-20-2025
10:11 PM
by
![]() Content Cleaner
Content Cleaner
- Mark as New
- Bookmark
- Subscribe
- Mute
- Subscribe to RSS Feed
- Permalink
- Report to a Moderator
See the Pulse and Transition Measurements analysis functions and example code.
http://www.ni.com/example/30782/en/
Also, for analyzing a transfer function or state-space model, there are functions in the NI Control Design & Simulation Toolkit.
07-29-2014 04:30 PM
- Mark as New
- Bookmark
- Subscribe
- Mute
- Subscribe to RSS Feed
- Permalink
- Report to a Moderator
A simplistic approach would be to low-pass filter both signals. Differentiate, and look for a threshold crossing that signifies a level change. You can subtract the indices of the threshold crossings and convert from samples to time to get td. After the first threshold crossing, threshold for a small value in the differentiated PV signal (i.e., where the slope returns to zero) to find the index of the "end" of the change. Find the Y values for both of these points to get the total change in PV and multiply by .63 and add that to the initial. Now use that value to threshold the raw (or filtered) PV signal to get that index. Again, subtract the indicies and convert to time; now you have tau.
YMMV. You may not need to filter (or even differentiate) the process signal; it just depends how clean and consistent it is.
Good luck!
