- Document History
- Subscribe to RSS Feed
- Mark as New
- Mark as Read
- Bookmark
- Subscribe
- Printer Friendly Page
- Report to a Moderator
- Subscribe to RSS Feed
- Mark as New
- Mark as Read
- Bookmark
- Subscribe
- Printer Friendly Page
- Report to a Moderator
Contact Information
University: Harbin Institute of Technology
Team Members (with year of graduation): Pingfan Song, Jianing Zhang, Aiqiang Lei,Congru Yin, Tingting Yao
Faculty Advisers: Ning Fu
Email Address: song.ping.fan@163.com
Submission Language: English
Project Information
Title: Analog Information Converter (AIC) experimental platform
Description:
ADC's high sampling rate brings us too much redundant data. For example, our camera generally preserves 10% total data and discards the remaining 90% after compression. AIC is a new technique that different with ADC. AIC converts analog signal to valuable digital information that we just need. By this way, we can break though the limit of Nyquist sampling theorem and significantly reduce the sampling rate and data volume. Our design is a showcase of AIC's wonderful effect.
Products
PXIe1082, PXIe-PCIe8375, LabVIEW 2011 and some devices driver (NIDAQ...)
The Challenge
How to reduce the sampling rate of multi-tone analog signal and data volume? How to synchroize multiple tasks effectively?
The Solution
As shown in Figure 1, x(t) is an input analog signal which is sparse in frequency domain. We utilize the ao function of PXIe-6368 to output the test signal. pc(t) is a pseudo-random sequence with values of {±1} and it alternates between values at or faster than the Nyquist frequency of the input signal x(t). We utilize the ao function of PXIe-5442 to output the sequence. x(t) is multiplied by pc(t) in a mixer or multiplier. Multiplying a signal with another in time domain means convoluting their spectrums in frequency domain. In this way, input signal’s spectrum is spread and every point in frequency domain contains all the information of the input signal. An analog low-pass filter follows the mixer and then a traditional ADC samples the output signal at low sampling rate. Finally, the input signal is reconstructed in computer from the sampled data using some optimization algorithms.
3.png)
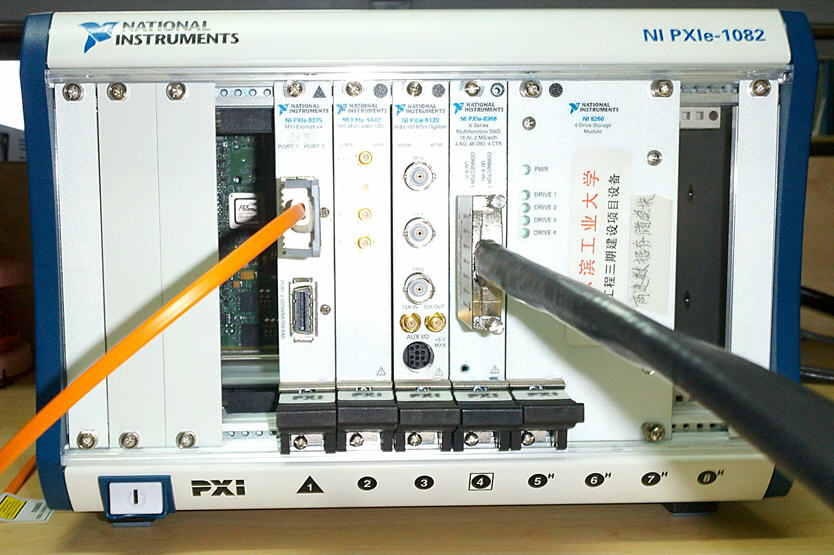
figure 1 AIC frame and hardware system
<Explain the benefits using LabVIEW and NI tools.>
LabVIEW and NI tools help us accomplish our project more quickly and more effectively. And the experiment results are more credible.
<Insert image(s) of project with captions.>
 figure 2 startup screen
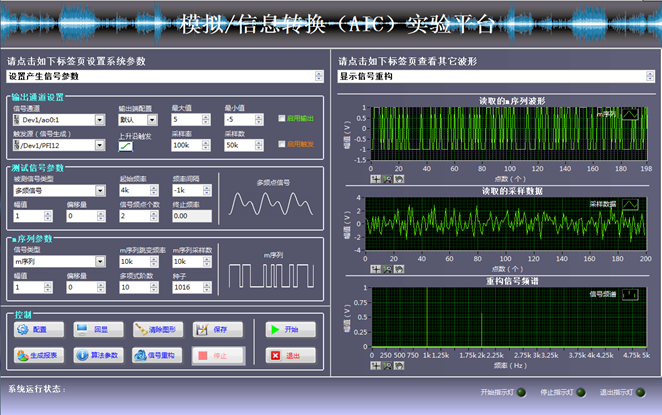
figure 3 main screen
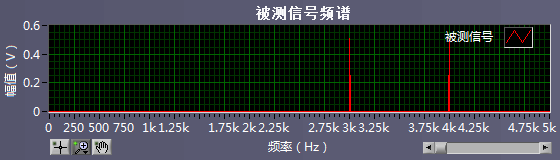
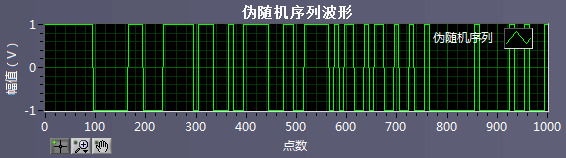
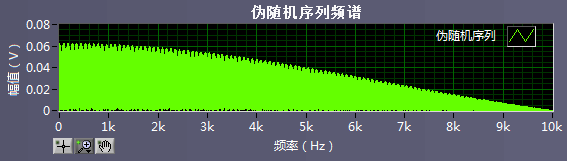
figure 5 the wave and spectrum of a pseudo-random sequence
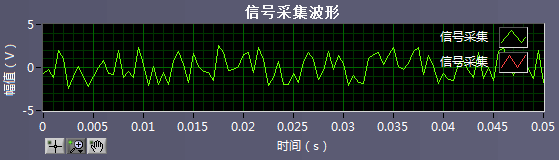
figure 6 sampled data with 2kS/s sampling rate
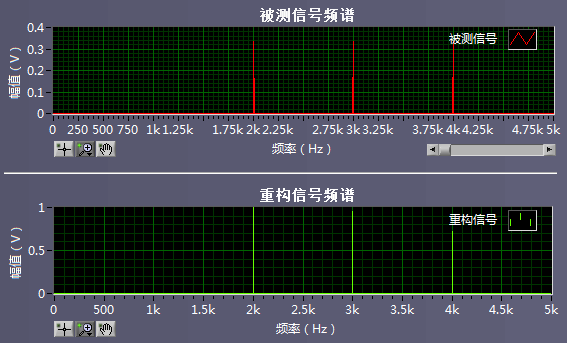
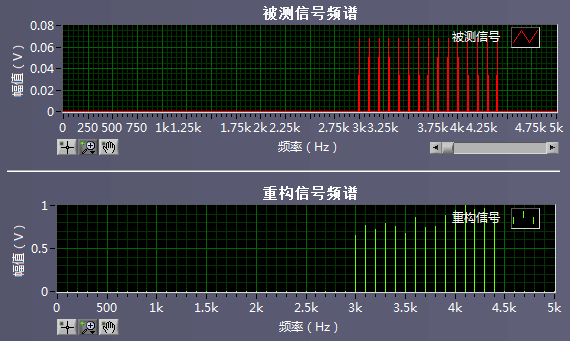
figure 7 the spectrum of original signals and reconstructed signals
<Insert video here.>
<Attach VI code (optional).>
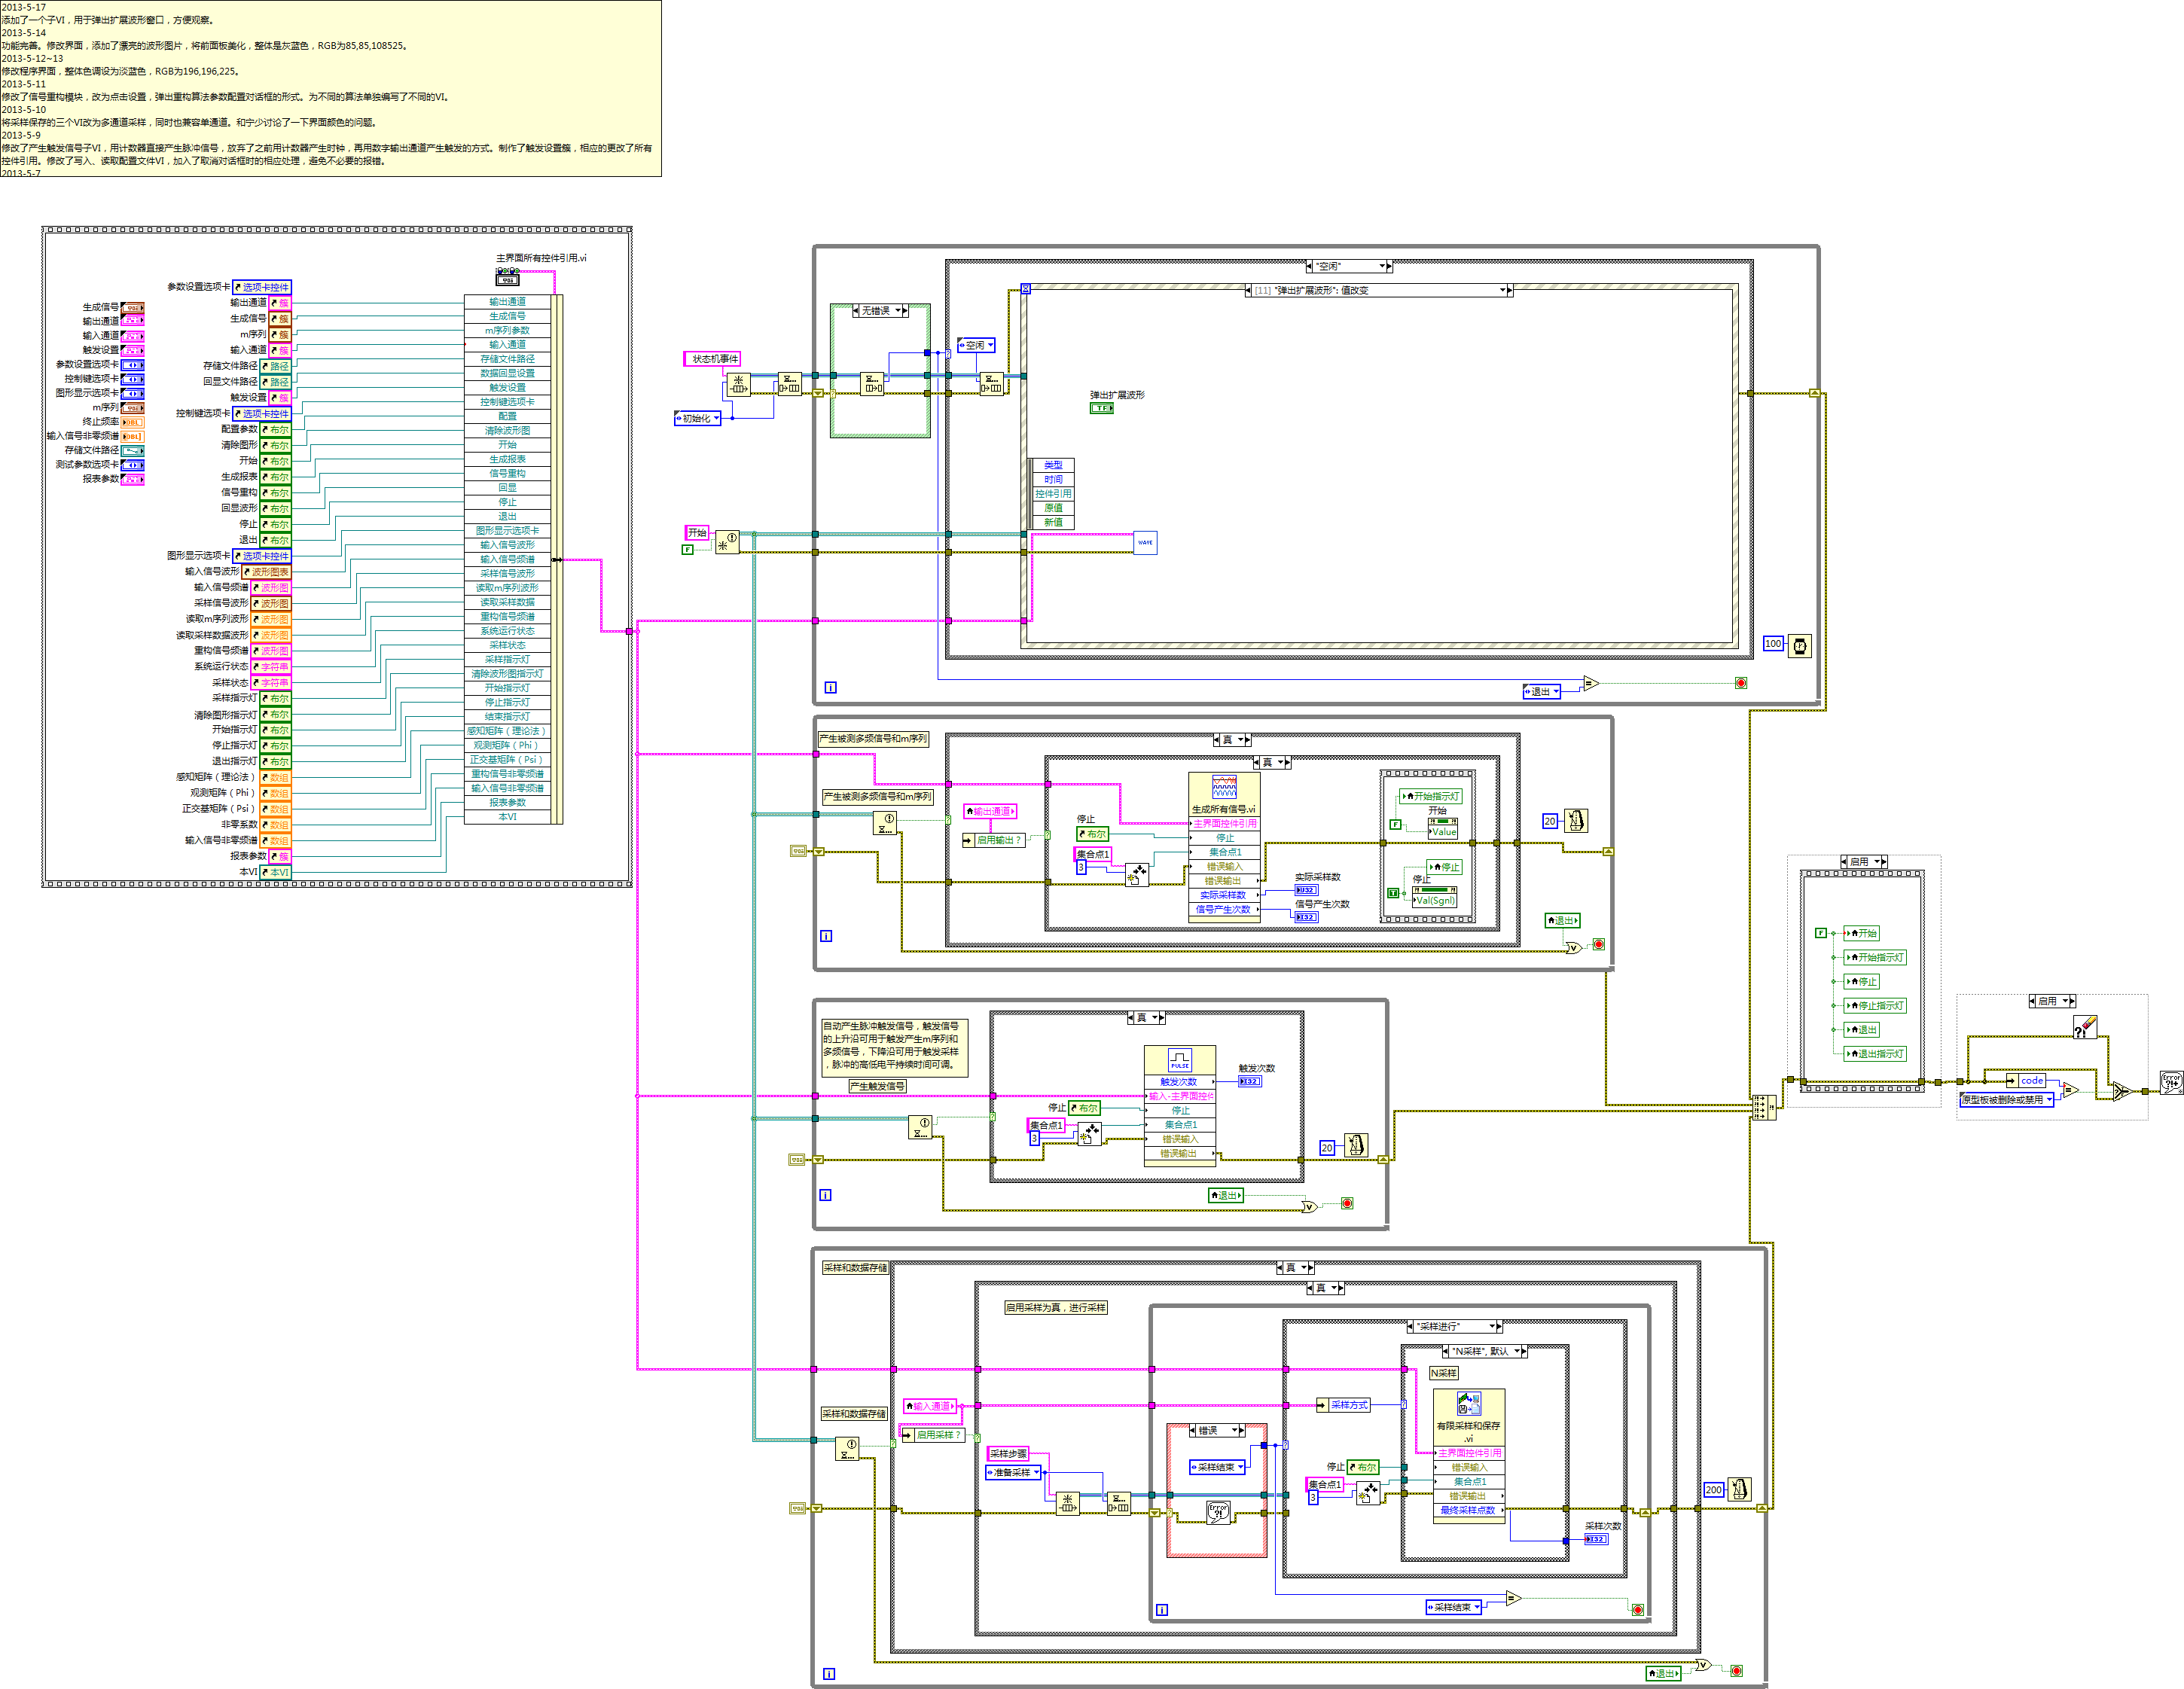
figure 8 the main code

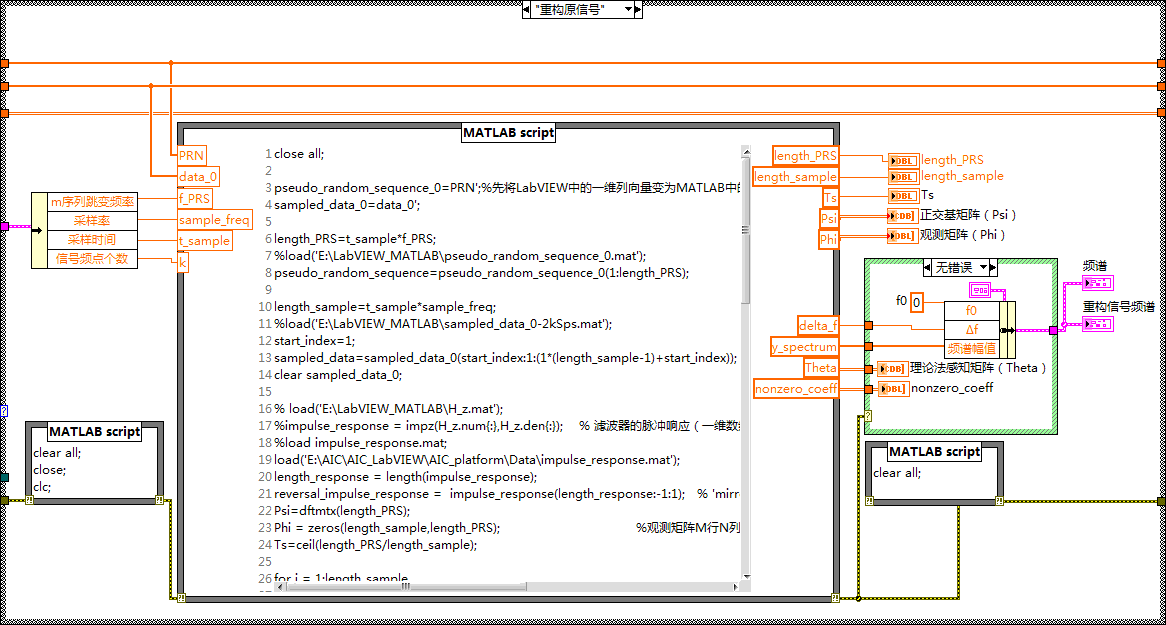
figure 9 the codes of a part of VIs
<Level of completion (beta, alpha, or fully functional)>
<Time to build>
<Additional revisions that could be made>
Attach Poster (30 in. x 38 in.) and LabVIEW Code
<Include captions for all graphics material. Type your photo or graphic caption underneath each graphic using this 10 pt Times New Roman font. Embed all graphics. Remember—you must provide individual electronic files for each graphic you include in your paper. Place photos in text after first reference—you must include a reference to all graphics in the text. Include screen captures if you use National Instruments software products. Screen captures must have a minimum resolution of 72 dpi at 100 percent. All other graphics must have a minimum resolution of 300 dpi.>
Nominate Your Professor (optional)
<Insert nomination. Does your professor use LabVIEW or other National Instruments technology to make learning difficult concepts engaging, interesting, and fun? If so, nominate him/her as an outstanding educator by telling us who they are, what they teach, and how they make learning a better experience for you.>
