- Document History
- Subscribe to RSS Feed
- Mark as New
- Mark as Read
- Bookmark
- Subscribe
- Printer Friendly Page
- Report to a Moderator
- Subscribe to RSS Feed
- Mark as New
- Mark as Read
- Bookmark
- Subscribe
- Printer Friendly Page
- Report to a Moderator
Contact Information
University: National Advanced School of Engineering (YAOUNDE)
Team Members (with year of graduation): (1) KING TANGWA, (2) MBUWIR Brida, (3) TCHAMABE NGAKO
Faculty Advisers: Dr LELE
Email Address: lelechristian@yahoo.fr
Submission Language: English
Project Information
Title: Bus Informations Provider System In Urban Zone
Description:
Abstract
In every towns in Cameroon where people can use bus, it is impossible for those who are on standing points to know how long they are going to wait for the bus too reach . Hence this project aims to provide these populations with a system which enable to know , at every time the position of the bus and the remaining time they have to spend so that they can easily decide whether they wait for the bus or they use another way to get where they need to. Hence it will result a better management of time versus theirs financial resources
Others materials needed:
- Four (04) FM antennae
- Two (02) AM antennae
Project Introduction
The effective management of time is not always easy for the people whose daily activities demand movement over long distances and who choose displacement by bus.Indeed this one although very cheap is not available constantly. Especially, those which wish to borrow it never know how long it will have to pass to see the next one drunk. That can only generate idleness, stress and waste of time to the stop-buses. The system in question in this project will thus make it possible to the users of the bus to be informed, by display panel or telephone network, in real time, of the position of the buses, but especially of the approximate duration before the arrival of next one.
As regards the control speed in the zones appointed at the risk on the axes heavy, this system will be able to make it possible to control the average velocities of each vehicle concerned and thus to apprehend the culprit easily so that it is sanctioned by the law. Indeed the excess speed is the first major cause of the traffic accidents.
Products
The use of NI myDAQ and labVIEW:
Before, note that the system consists, first, in communication between transmitters points located on the itinerary of the bus and the receiver which is installed inside the bus , and secondly the communication between the transmitter installed on the bus and the Final Receiver located at the control center. The NI myDAQ, installed directly after the final receiver, is going to be used for determining the fundamental frequency of the detected transmitters points that will lead , by using labVIEW ,to derive the bus information and post them on a display panelcontrolled by the myDAQ. Since the bus information can be computed thanks labVIEW, a telephone operator may then use that opportunity to offer to bus users a new service that would consist in providing them with those information.
Design Methodology
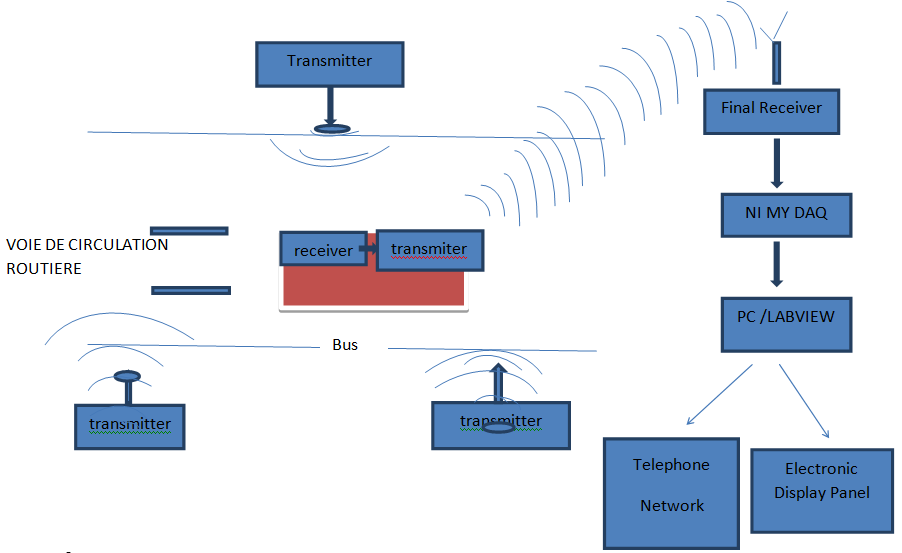
Firstly the itinerary of the bus is divided in two parts or more. At every intersection is installed one transmitter device with different signal fundamental frequency and the same transmission frequency. On the other hand a transmitter and a receiver are installed inside the bus is set so that the receiver is tuned up with the road transmitter frequency. Secondly the transmitters are set such that their reach area do not touch each other.
When a bus gets in a transmitter area, it detects its signal and sends the information to the Final Receiver through the bus transmitter. Thus the signal can reach the NI my DAQ. At this point the Bode and Dynamic signal analyzers will enable to derive the fundamental frequency of the detected transmitter, that is, the location of the bus at that moment.
When a sequence of transmitter detections observed NI labVIEW will enable to determine at same time the area where the bus is located, the direction it is moving to, and the average of its motion (and then the approximate remaining time to reach the next terminus). Hence this information can be put in a telephone network or displayed on an electronic panel device connected to the NI myDAQ.
Design Structures
1. Emitting Stations
They constitute principally of radio operator emitters. These emitters operate on the same frequency band. Hence to avoid interferences
Their carrier must not be more than 200 meters And the distance between them should be at least 500 meters
In connection with their working frequency, we find judicious gam WIFI 2.4GHz for its good quality but for the prototype which we have,
As regards the frequency of the useful signal, each station has a frequency which identifies it.
2. Reception/Emitter Of The Bus
The receptor of the bus has the same technology as the emitting stations and grants on those. It receives the signal emitted by the stations (one at a time), asks and sends the useful signal to the emitter. The emitter part of the bus does not have same technology as the others. Because its carrier must be far greater than that of the emitting stations (it is to cover by the bus track as a whole) we will choose a modulation which offers a larger carrier i.e. the amplitude modulation AM.
Thus each bus receives signals of the stations decoded and emits an AM signal towards the command control. Let us note that these AM signals have as frequency, the carrier frequency of each bus and as modulated frequency the frequency of the station detected.
For our prototype, we will use the following assembly
3. Receptor of the Base Control
This will be an AM receptor, considering the fact the bus emitters are AM. However, contrary to the usual AM receptor, it will do nothing but collect the AM signals and amplify them without their demodulation. Since all the frequencies it contains are useful information (frequency of station, and frequency of bus) it will be thus constitute {circuit of agreement +amplifier) each one of them being linked with the receptor of a bus.
In our prototype we took the simple case of a system with just a single bus; thus only one block {circuit of agreement + amplifier}
4. Numeration and Frequency Analysis of Signals (Mydaq +ELVISMI)
Here the NI MyDAQ plays an important role. Indeed, it allows the numeration of signals in the receiver block. This then permits the frequency analysis thanks to ELVISM.
5. Why Frequency Analysis
The frequency analysis allows the determination of the carrier frequency of each signal received and that of the useful signal. Thus thanks to the MyDAQ Assistant of LABVIEW one can extract this information and get:
The bus emitting by the carrying frequencies
The station detected
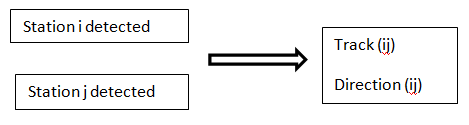
Data Processing and Discrimmation of the Cases
Here we have to determine the location of the nearest bus being displaced towards a given station. This will be made possible by a program implemented in Labview whose algorithm is given below:
Transfer of Data towards a local area network or GSM/CDMA
This level, we have to transfer information about the state of the system, that is to say for each terminus we have to say at which point on the track (“troncon” in French) is located the bus closest to the station (terminus) and the approximate it will take to reach the station.The LABVIEW tool "" makes it possible to get this information.
Display Panels Commands
This command depends on the display system we wish to use.The simplest case is on the one hand to use simple indicators (led, bulbs etc…) to indicate the bus positions and on the other hand to directly connect them or by a relay to the port of the MyDAQ. In this case one will be limited to avoid commanding and what is put in place (used in our prototype) or we could use an additional decoder for the tracks and the bus stops such that its outputs are connected to a microcontroller where the messages are pre-register and which controls the display panel.
Functional Desciption
In normal conditions the persons that can act in this project are essentially either technicians or who can ask for tuning/setting equipment or managers of the control base center. This is because the user of the bus will be checking just the information on the display panels or consulting the telephone network for the same purpose. Hence the previous functions can be technically explained as follows; regarding the interaction between the system and the actions.
Transmitter Stations
Here the technician will have to set the transmitter devices by setting the carrier frequency and that of signal in base band. They will also have to adjust the signal level in order to avoid interference amongst the transmitter devices.
1. Bus receiver and transmitter
In this case the technician has to tue the bus receivers to frequencies of the station transmitters. (all of them have the same carrier frequency).
Each bus transmitter is set to its own carrier frequency (but the applied modulation remains the same).
Note: in the case of an accident or any other problem one must be able to (driver or any other person) to disable the bus module so that the bus concerned can no longer be considered by the station control base.
2. Final Receiver
Since this module is of several receivers, which are supposed to deal with the bus transmitter frequencies respectively, the technician has to execute such settings appropriately. That is according to the sensitiveness required by the MyDAQ to analyze the detected signal.
Acquisition, Spectral Analysis and Command
At this level the core is the system. Thus it is the system manager who is the main actor here. He will have to enter some practical data and information such as:
- The itenary (path) parameters such as
* The overall length length of the itenary
* The distances between adjacent transmitter stations
* The names of inter-station zones.
- The transmission/reception parameter like
* The base band frequency of each transmitter station
* The carrier frequency of the set of station transmitter
* The carrier frequency of each bus transmitter
Display Panel
The main function of this module is the provision of bus users with information on the bus position on time. The users will receive information on the next bus coming towards the station where they are. This information contains like
- The present position of the nearest bus
- The approximate time at which the bus will reach the station where they are.
Information Networking
Here the manager will have to configure the data transfer. This is possible using the “file dialog” virtual instrument labview. The manager will have the target of the file location or parameters of the data base which will be used by the telephone operator to provide his/her customers with information.
Results and Discussion
1. Problems Faced, Proposed Solutions And Challenges
Whatever people intend to do, it is not always as smooth as they wish it to be. While working on this project we were faced with a lot of challenges some of which include
- The fact that we received the materials which could enable us start the work very late. Hence we could not fully exploit the materials at the period when school work was not yet too intense.
- The second challenge concerns the additional material which we applied for, the FM and AM antennae. This made us to change the initial model of the prototype we wanted to construct. We were obliged to use a prototype with components we could afford.
- We decided to work more on theLABView programming environment as well as on Multisim and ELVIXSIM. Designing circuits on multisim was not quite easy at the beginning. With the help of the NI website and much hard work we were able to succed.
Prototype Presentation
As earlier mentioned, since the additional materials were not available, we modified the initial set up as follows
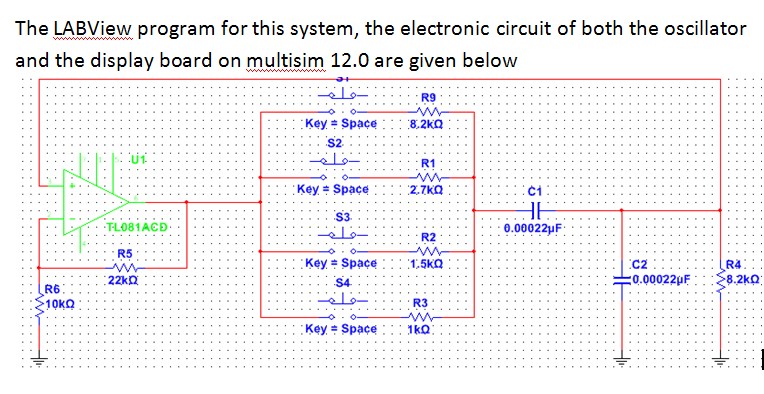
Instead of the “station transmitters to final receiver” chain we have constructed an oscillator with adjustable frequency. Hence we simulate the transmitter stations which are detected by setting the oscillator frequencies at their base band signal frequency values.
To simplify the presentation of the output display, we used a set of diodes-LED; two red-colored LEDs for the terminus points, three-green-colored LEDs for the track (troncon) signaling and two multi-colored LEDs for the two directions (that is either away or towards a particular station).
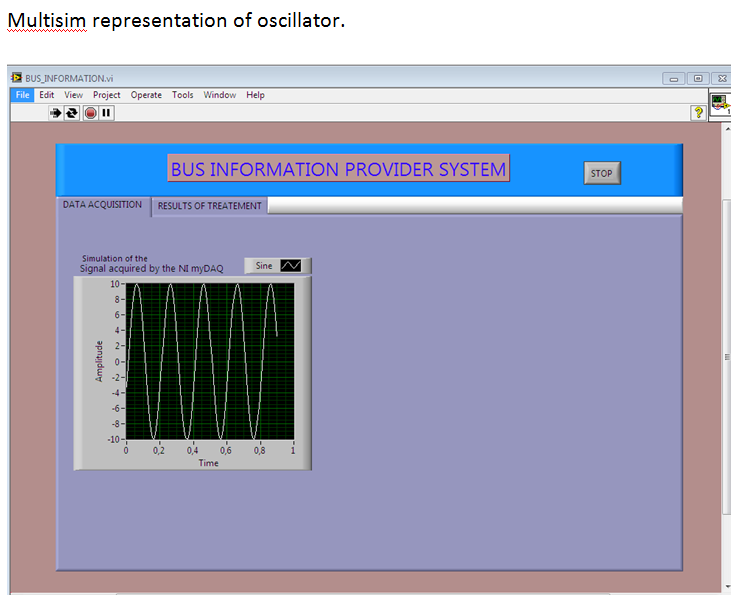
Here is the home windows when launching the program, this part represents the signal received by the NImyDAQ. As myDAQ is not connected we have generated a simulated signal.
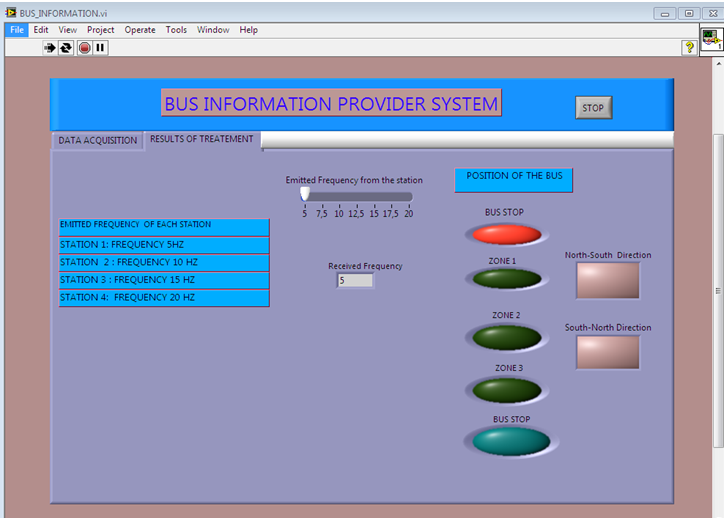
Here is the second field where we will use the frequency received by the bus to control the panel which indicates the position of the bus. Now you can see that the led “BUS stop “ is activated meaning that the bus is not yet in movement.
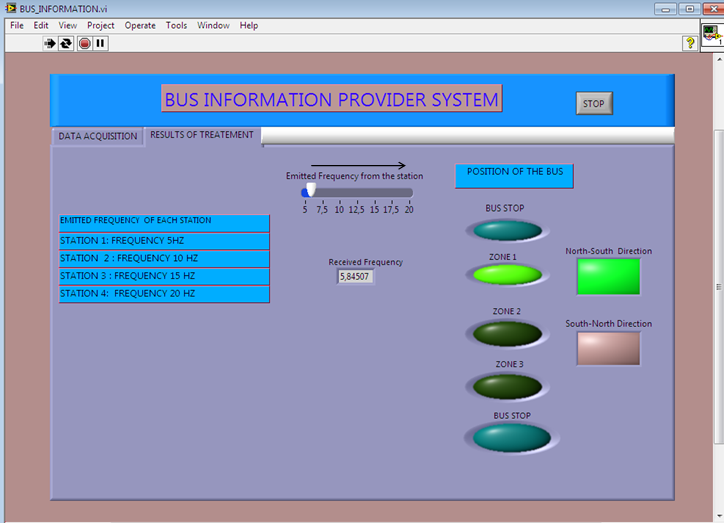
Here we have moved the cursor meaning that the frequency 5Hz is not yet received by the myDaq when the bus becomes in movement. The North-South Direction led is activated meaning that the bus is going in that direction and is in the zone 1.
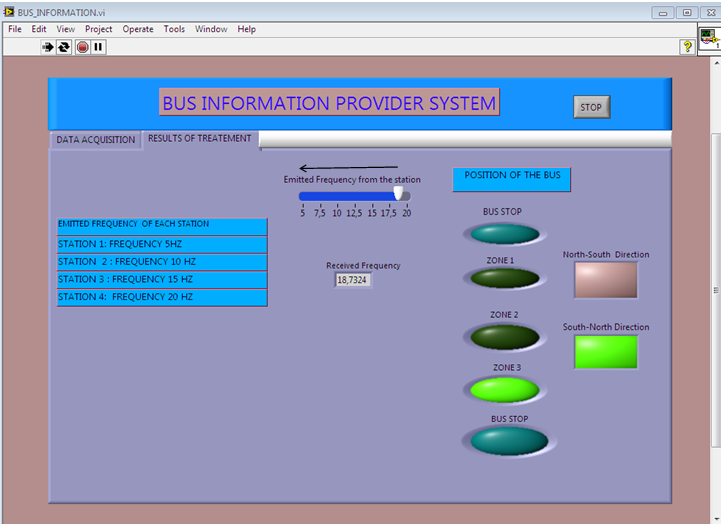
Here, the bus starts the movement and is going in the South-north direction and is in the zone 3.
Benefits from using LabVIEW and NI Tools
There are several advantages when using labview which caught our attention, some of which include
- With labview, it is very easy to design graphical interfaces for applications. This is because a script is not required to get this done.
- Labview provides a possibility of storing information directly that is in real time. This permitted us for example to record the velocities of each bus at different periods of the day. This data helps us ti establish statistics which will contribute to the improvement of the calculation of the time for the arrival of the bus.
- Multisim offers many more instruments like the pro-ject board which are absent in other softwares similar to it. This offers the possibility of realizing the circuit simulated in multisim on the board. This was so interesting.
- The NI MyDAQ was just of so much use. It is this instrument that we can say is the heart of this project. It helped us as earlier mentioned in many situations like the acquisition of frequencies from the bus. Knowing that this project exploited just a fraction of what MyDAQ can do, we know that it can be used for many other complex projects.
Abstract
Given that the transport buses in circulation in Cameroun are managed by the services of the council, it would thus be necessary to approach those in charge and speak to them about the project and with a financial study made on a precise circulation zone. We will also need to explain to them. We will also need to make them see the benefits of this project to the population of that area especially to students. If they agreeIf they agree and accept that the project be implemented we can then go on to implement the project. Once the project is implemented, the information on the position of the bus through LABVIEW since it would be easy to record them and to propose it like a service with the telephone operators in Cameroun like MTN and Orange.
Impact of this project on social and environmental factors
As mentioned in the introductory part of this document, the main reason for this project is for a better management of time. For example; if you desire to go somewhere and you know already at what time the bus is going to arrive, you can then decide either to wait for the bus or to use another transportation means maybe a taxi or a motorbike.
The fact that the bus users already know the time the bus has to arrive as well as the manager of the bus station is very useful as the driver can no longer do any illegal transactions like using the bus for other purposes as he will be discovered easily. There is also a continuous functionality of the transportation and hence a better business.
This project will create an opportunity for the telephone operators to introduce a new service that will consist in providing people with bus position information thus making money.
Conclusion
The problem that people face in towns and cities on bus usage can be solved with the system proposed in this project. This will allow the management of time and money even.
Working with this project was really quite interesting as we faced a lot of difficulties which in the end we were able to propose solutions ourselves.
