- Document History
- Subscribe to RSS Feed
- Mark as New
- Mark as Read
- Bookmark
- Subscribe
- Printer Friendly Page
- Report to a Moderator
- Subscribe to RSS Feed
- Mark as New
- Mark as Read
- Bookmark
- Subscribe
- Printer Friendly Page
- Report to a Moderator
Contact Information
University: University of Ngaoundéré
Team Members (with year of graduation): (1) TEKOUA KOUEMENE Vincent De Paul, (2) NGATCHEU TCHIENTHEU André Mitérand, (3) FOTSO KAMDEM Kevin.
Faculty Advisers: Pr. Laurent BITJOKA
Email Address: lbitjoka@yahoo.com
Submission Language : English
Project Information
Title: Influence of Temperature on the Crystallization during Storage of Honey
Description:
Abstract
The primary task of bees is to collect nectar and pollen of honey plants and produce honey. In the process of preservation and storage, honey is going through transitional phase of crystallization which is controlled by temperature and humidity conditions in the storage medium. During the crystallization stage the level of liquid in the storage container changes. To track these changes over time as well as determine the relationship between the crystallization rate and the environmental conditions we have developed a system that monitors the temperature, humidity and liquid level over time and records their variations. An ultrasonic range sensor is used for measuring the liquid level change. It generates high frequency sound waves and evaluates the echo which is received back by the sensor. This echo is converted to a digital pulse and recorded by the measurement system that converts it into the level of the liquid. Continuous monitoring of temperature, humidity and liquid level has been implemented using myDAQ hardware and
LabVIEW 2012 SP1 software provided by the NATIONAL INSTRUMENTS. In order to determine the variation of liquid level of honey in a storage container over time and the variation of the rate of crystallization based on temperature and humidity in the storage facility we have ran a number of experiments using a pot of honey harvested in the traditional manner. A hot plate heat from 0°C to 300°C and we followed temperature and the level of honey in the pot during 2 hours. Our results show that the level of liquid in the container has decreased over time as a result of evaporation of water in honey. Temperature increased in the pot but not proportional to the temperature of the hot plate. We did not observe crystallization as me mention previously because the protocol was not appropriated. Nevertheless, we observed that honey don’t
gate boiling as water cause of his density.
Introduction
Crystallization is the phenomenon by which the parts of a liquid substance that was closer to each other based on a number of parameters to form a solid body. Crystallization depends on the composition of honey and therefore its floral origin (Lequet, 2010). It is important to note that during storage, all honeys eventually crystallize in a period shorter or longer, due to their saturation sugars. When the concentration of sugar (glucose, fructose, sucrose, maltose) exceeds the solubility limit, honey does not crystallize until a certain energy threshold has not been reached. This threshold is the boundary where the crystallization will really begin. To cross the border, it takes outside intervention such as changes in temperature, agitation, or the presence of primers (elements favoring the aggregate). The honey extraction is usually liquid, when the temperature decreases, the solubility limit is exceeded and the honey will form crystals primers (Dailly, 2008). The stage of crystal growth can then begin. By this reasoning, the more the temperature decreases, the honey will crystallize easily. However, the formation of sugar crystals requires several steps. The first of these steps, the pre-crystallization, depending on the sugar molecules collision between them and, thereby, is dependent on their mobility in solution. At low temperatures, the ground freezes and mobility is slowed. Conversely, at higher temperatures, it is accelerated and the phase of formation of crystals
decreases (the solubility limit is not reached and the conditions are not met). There is a need to find an ideal temperature that will compromise between these phenomena. A study by Dyce (1931) to
determine the temperature crystallization promoting honey, illustrates the link between the storage temperature and texture of honey. Therefore, control of the temperature and humidity in the storage chamber can help determine parameters ensure the availability and preservation of a liquid honey or fine crystallization at all times. This phenomenon of crystallization occurs with a considerable loss of water through evaporation, which can be the cause of the decrease in the level of honey in the container.
Products
I- Materials and methods
The material we used to work was provided by National Instruments. This is the company behind the graphical programming and therefore the creation of LabVIEW. It has existed since 1976 and is headquartered in Austin, Texas, United States. Operating in more than 40 countries, their customers are more than 30,000 companies in 90 countries.
I- a) LabVIEW
By definition, LabVIEW means (Laboratory Virtual Instrument Engineering Workbench). It is a dedicated programming language for instrument control and data analysis. It is based on a graphical programming environment, using the notion of data flow for scheduling operations including acquisition, analysis, processing and presentation of data. For data acquisition and National Instruments innovation Design Competition 2013 instrument control, LabVIEW supports standard RS-232/422, USB, IEEE 488 (GPIB) and VXI/PXI, and data acquisition cards. For analysis and data processing, the library contains extensive analysis
functions for the generation and LabVIEW includes a large number of presentation elements such as drop graphs, XY graphs, the Smith charts, gauges, dials needle. When starting the software, there
are two windows that open (the front panel and the program). In the program, the user selects and places the virtual instruments (VI) which reflect exactly the problem it seeks to solve. Thereafter the
user connects virtual instruments each other, in a decreasing order, from controllers to connectors. At the same time it creates on the front panel graphic objects translating what user write in the
program code. When executing the code, the front panel presents the results of the completed application (POUSSET, 2009).
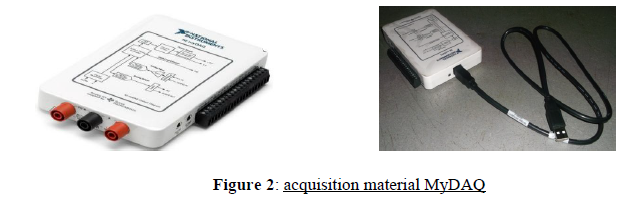
I-b) MyDAQ
By definition DAQ means Data Acquisition. It is a multi-function card acquisition, ownership National Instruments, which includes among other function multimeter, generation and acquisition of analog signals ± 10V, generation and acquisition of digital signals encoded on 8 bits. It also provides stable DC voltage of 5V and ± 15V. It interacts between the prototype and LabVIEW via a USB connection.
II) Measurement of distance using ultrasound
Ultrasonic low power (a few milliwatts to several hundred milliwatts) is used for his propagation properties in circles. The general principle is to transmit an ultrasonic pulse in the medium, and with the same transducer or another one, to capture echoes of the pulse produced by the medium or at the border areas. Ultrasound techniques are widely implemented and developed in various fields. For the identification and control techniques, we are interested in the measurement of distance so the ultrasonic transducer is a proximity sensor which is characterized by the absence of a mechanical connection with the object it measures the distance (measured without contact).
Theoretically, for measuring distance (d) by ultrasound, we consider that the propagation of ultrasound is done at a constant speed (C) which is the speed of ultrasound in the consider material.
The round trip time, for the pulse to reach the target and return to the receiver is given by the
following relationship:
t0 = 2d / C, where d = t0 * C / 2. (1)
This relationship is an indirect measure of (d), which requires knowledge of the velocity of wave propagation in the medium to be study. The constant factor just means that this distance is
traveled twice to go by the incident wave and the reflected wave back (Revel, 1999).
The HRLV- Max sonar sensor 1013 can measure up to 5meters. It needs to be supplied with a 5 VDC (pin6) and realize the operation of generation and acquisition of a 40 KHz ultrasound wave. User have tree way to acquire the final signal. There is pulse width output (pin2) which represents the distance with a scale factor of 1uS per mm, analog voltage output (pin3) which give the tension with the factor of 0.977mV per mm and serial output (pin 5) which use a RS232 serial- USB cable to operate. Pin1 is for external connection of an appropriated temperature sensor, pin 7 is for ground (GND) and pin4 is for ranging start/stop.
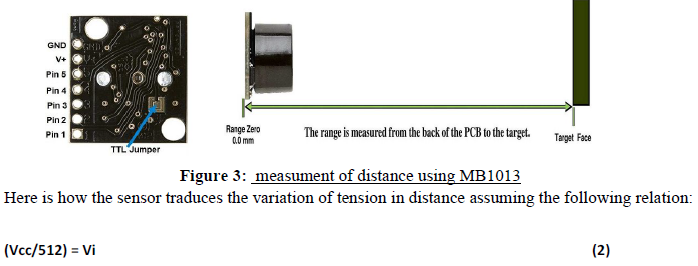
Vcc = Supplied Voltage Vi = Volts per inch (1 inch =2,54 cm)
For example with a 5V supply we will have [(5.0V/512) = 0.009766V per inch = 9.766mV per
inch].
III) Measurement of temperature
The sensor we package for this measurement is PT100 sensor. It is a positive temperature coefficient thermistor, packaging to be used in liquid milieu. It operate according to the following relation
Rpt=R0 (1+αθ) (3)
The increase is 0.385 per degree. Knowing that the probe measures from -50°C to 200°C, and also knowing that at θ=0°C, the resistance of the sensor Rpt= 100Ω, we have, at θ=100°C Rpt=138.5 Ω and at θ=200°C there will be Rpt=177Ω. (Meraud, 2008). For α=0.00385Ω/°C, we have the following relationship between sensor resistance and temperature:
Rpt=100(1+0,00385θ) (4)
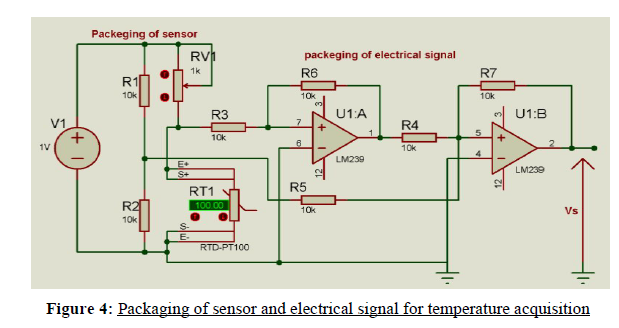
III- 1) Wheatstone bridge: Packaging of sensor
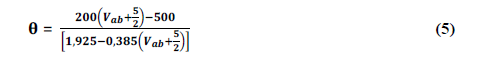
Wheatstone bridge helps us for the packaging of the sensor. It is a device which allows in specified situation, to determine the value of a resistance bridge which is unknown. we replace one of the resistors of the bridge by the PT100 sensor so that when its value will change because it is immersed in a milieu where temperature varies; it will also causes the modification of information in the central branch of the bridge. This information is the of balance voltage of the bridge. (Meraud, 2008). The relationship between temperature θ and of balance tension Vab is give as follow.
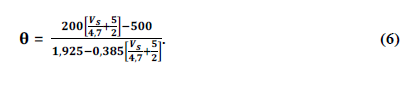
III-2) Packaging of the receive signal
Packaging of electrical signal provided by Wheatstone bridge is realized with a summinginverter. This device raises the level of the signal which is generally very low, in the order of mV, to a more appreciable value with a 4.7 ratio. It is built around two μA741 circuits, which offers the possibility of reducing the offset voltage.
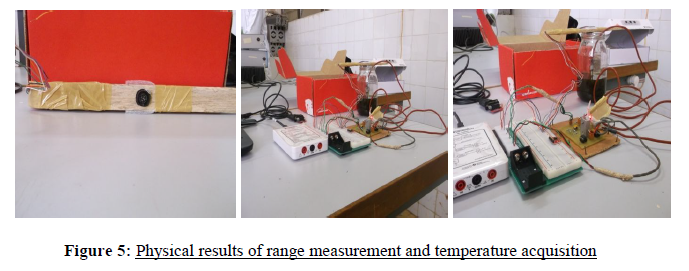
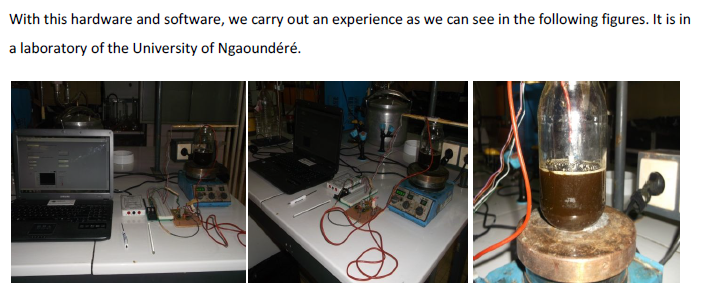
We can see in the following figure 5 the physical results of boot the range measurement of honey in a pot and the temperature acquisition in honey.
Results and discussion
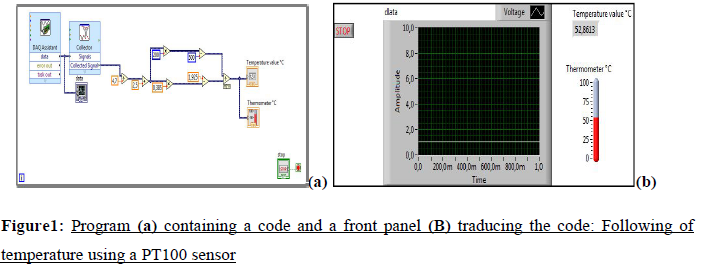
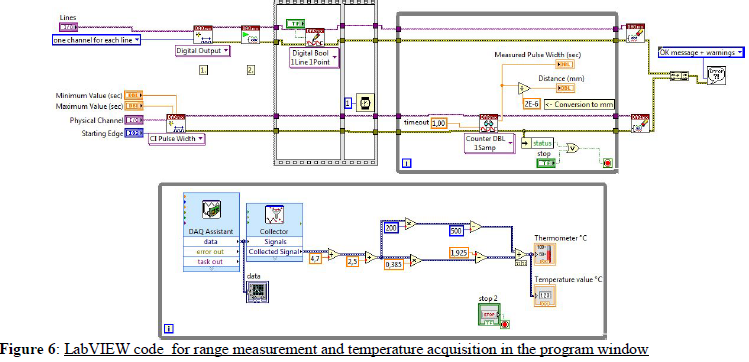
We first present the handle of LabVIEW and associated equipment. After it is the results we obtained with this combination of the software and hardware in the honey process. In the following figure we have the software (code and front panel) realized for this application.
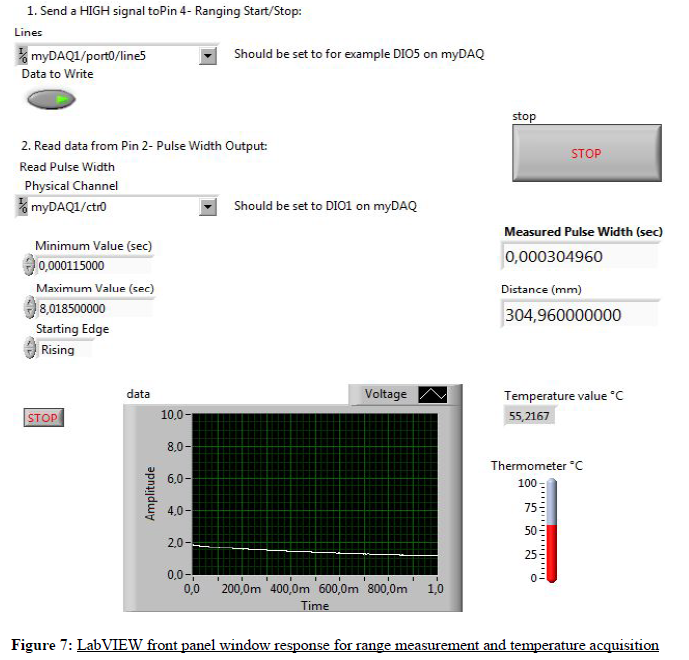
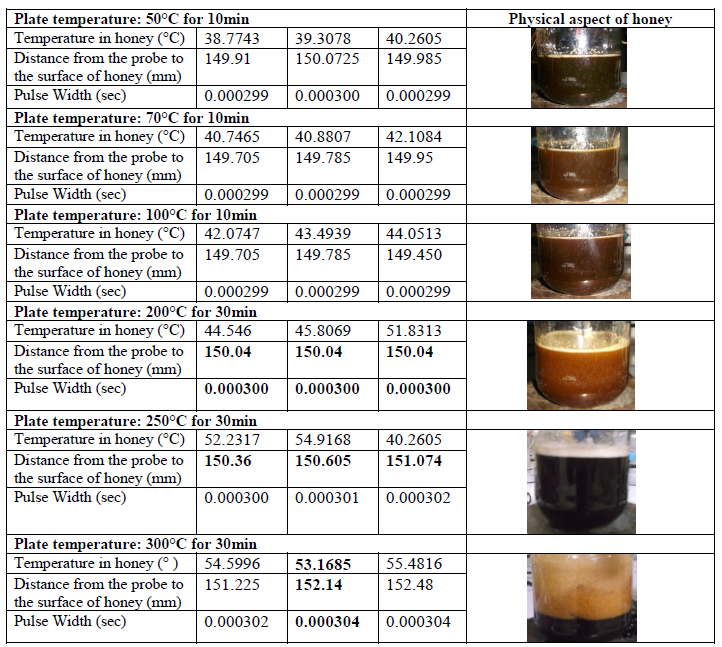
At the beginning, the hot plate is at 26°C, which can be considered as the temperature in the laboratory. We increased the temperature value to 50°C. The distance from the probe the honey in
National Instruments innovation Design Competition 2013 the pot is 150.042mm, displays by the interface. At the average temperature of 47.3949°C (the hot plate is 200°C), it can be seen during stirring that the honey becomes more fluid, the distance has still changed and remained constant at this temperature . Foam begins to be important above the honey at the temperature of 200°C, but that does not mean that the distance measured by the transducer decreased. It remains constant and tends to increase. It can traduce the fact that the foam is a transparent medium for the ultrasound. After 1h50min handling, the foam overflows the pot almost to the average temperature of 54.4165°C, the plate being at 300°C.
One would have thought that as the water boils at 100°C, the honey would be the same, which is not the case. Indeed honey is denser than water; the molecules that make up the structure are welded
strongly and therefore faster thermal conductivity.
Conclusion
The goal of this work was to evaluate the level of honey in a pot during temperature processing with the objective to observe crystallization of honey. This idea become possible by handing LabVIEW and MyDAQ provide by National Instruments for the case. We did not observe crystallization because the protocol we carry out was not appropriated consequence of lacking of time. Nevertheless we did some acquisitions and some observations that we think can be the base of future work. When we heat honey it is easier to mix it with sugar. Doing this, his color change and this can traduce the loose of some properties. We can use this specific color to know which honey still natural or not.
ACKNOWLEDGEMENTS
All the team thanks Mr SEV KAMENSKIHS, Applications engineer in National Instrument, for its quality of management.
REFERENCES
POUSSET N., (2009). course on LabVIEW software. Conservatoire National des Arts et Metiers (CNAM), 339 pages;
DAILLY H., (2008). Crystallisation of honey: To know and to do it. Abeilles &Cie n° 124, 5 pages;
BONAR T., (2012). “Finding distance using analog voltage”. Maxbotix Tutorial for high performance ultrasonics rangefinders;
Revel MP., Physics of ultrasound. Encycl Med Chir (Elsevier, Paris), Diagnostic Radiology - Principles and imaging techniques, 35-000-C-10, 1999, 14 p;
Meraud A., (2008). «Temperature sensor PT 100» Lycée d'Arsonval 65rue Bridge Créteil 94107 Saint-Maur cedex;
Lequet L. (2010),"Du nectar a un miel de qualité : contrôles analytiques du miel et conseils pratiques a l’intention de l’apiculteur amateur", Thèse de Doctorat, Université Claude-Bernard -Lyon I.
«http://fr.wikipedia.org/wiki/conductivité_thermique.» Accessed Août 12, 2007;
«http://www.ivaldi.fr/capteurs de température.html.» Accessed ctobre 28, 2007;
«http://fr.wikipedia.org/wiki/thermistances&action.» Accessed Août 12, 2007;
