- Document History
- Subscribe to RSS Feed
- Mark as New
- Mark as Read
- Bookmark
- Subscribe
- Printer Friendly Page
- Report to a Moderator
- Subscribe to RSS Feed
- Mark as New
- Mark as Read
- Bookmark
- Subscribe
- Printer Friendly Page
- Report to a Moderator
New Student Design Competition 2015: A Photoplethysmographic Wearable Sensor Design Application
Contact Information
University: University of Southampton
Team Members: George Alexopoulos (2017)
Project Supervisor: Dr Dina Laila Shona
Email Address: ga2g12@soton.ac.uk
A Photoplethysmographic Wearable Sensor Design Application
Description:
Reflectance based Photopletgysmography (PPG) is an optical technique which can non-invasively monitor pulse rate. Current commercial technologies use PPG however its accuracy is greatly debated by many. In this project, a reflectance based wrist PPG sensor was created utilizing a digital Lock-In Amplifier implemented on the FPGA chip of the myRIO. This software tool was provided to use and test from Delacor, an alliance partner of National Instruments. The device was compared with the MIT Elilte Pressure Blood monitor and an ECG monitoring unit from BIOPAC Systems and was found to be able to accurately make pulse rate measerements with an error of ±1% and ±6% respectively.
Products:
NI Hardware and Software:
myRIO
LABVIEW
Rest Hardware and Software:
AcqKnowledge Software Platform
MIT Elite Pressure Blood Monitor
BIOPAC ECG 100C Amplifier
BIOPAC MP100 Data Acquisition system
BIOPAC UIA100C Input Module
The Challenge:
Design and create a photoplethysmographic sensor to non-invasevely monitor pulse rate and evaluate how accuretely measurements can be obtained through PPG.
The Solution:
The designated aim of the project was to design and implement a reflectance based Photoplethysmographic wearable sensor to obtain heart rate readings from the subject’s wrist. This was achieved whilst determining the reliability of our results. In the beginning, a background research was conducted to attain knowledge of the principles of Photoplethysmography, the existent methods of measurement, the components required to create our sensor, the factors that would affect our signal and the principle of operation of Lock-In Amplifiers.
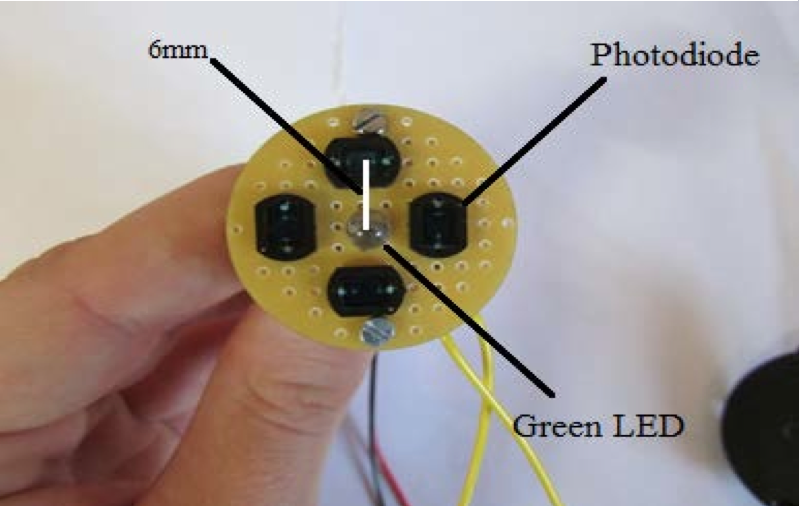
For the PPG probe, a green LED light source was selected, as it has exhibited the best performance for heart rate readings. Four photodiodes were placed in a circular configuration which captured the reflected green light from the subject’s wrist with a separation distance equal to 6mm from the LED.
 Figure 1: Top View of PPG Sensor
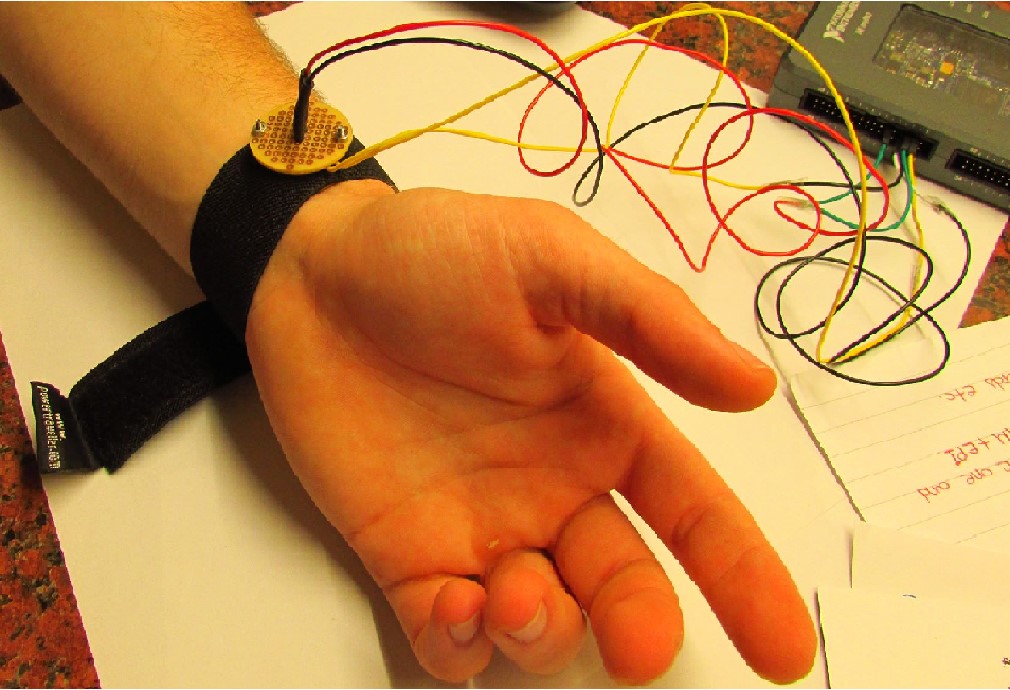
This geometry of our sensor resulted into strong PPG signals since an array of photodiodes in photovoltaic mode were used and light from all angles could be detected. Once all the components were configured and soldered, the sensor was attached to a Velcro strap. This would prevent ambient light affecting our PPG signals but also maintain a constant pressure force between the user’s wrist and the sensor whilst minimizing any movements.

Figure 2: PPG probe on subject's wrist positioned above the radial artery where maximum blood transfer is observed
The digital Lock-in Amplifier (LIA) provided by Delacour was set to obtain analog inputs at a sample rate of 50ksps. The digital Phase Locked Loop within the FPGA then locks the input signal from Connector A/AI0 and generates a sine wave of the same phase and frequency with the reference signal and a quadrature signal which is a 90 degrees shifted version of the sine wave. In addition, filtering is a crucial part of the signal processing and for this reason two low pass filters are used to eliminate everything except the signal centered around 0 Hz.

Figure 3: Sensor components with FPGA block diagram
Second order (40dB/decade) low pass filters were picked with a time constant of 200ms since they offered the cleanest signals possible. To further eliminate any DC offsets and additional low frequency noises, a 4th order, 5Hz high pass filter was implemented. Once the in-phase (I) and quadrature (Q) components of the signal have been generated in the FPGA, the main VI demodulates the two signal components and applies a scale factor to convert to a waveform expressed in units of Volts. Finally, the fundamental is extracted from the waveform which resembles the heartbeat signal in Hz. Simply by multiplying this value with 60 we obtain heart rate readings in the Front Panel of LabVIEW.
Further information for the LIA can be found in Delacor's: https://www.ni.com/en/support/downloads/tools-network/download.lock-in-amplifier-for-myrio.html
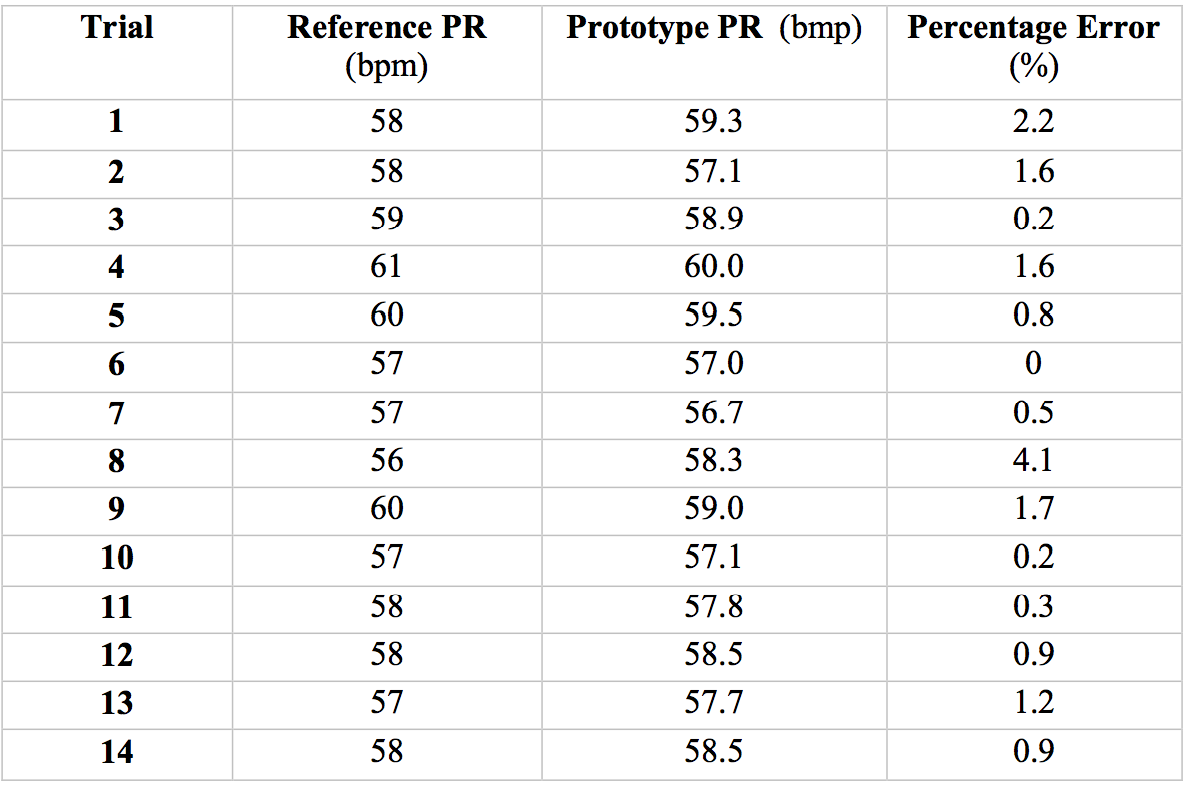
Once the system was tested and concluded that it is working properly a comparison had to be conducted to evaluate its reliability. For this reason we used the MIT Elite blood pressure monitor and the BIOPAC Systems ECG 100C monitor for long and short time interval calculation of bpm respectively. For the short time interval comparisor, the inaccuracy between our system and the blood pressure device for the 14 trials each lasting 36 seconds was ±1.2% which is very small. The average bpm of 36s was calculated since the Omron device required almost that time to calculate and output heart rate.

Table 1: Reference, prototype BPM values and percentage errors for fourteen trials
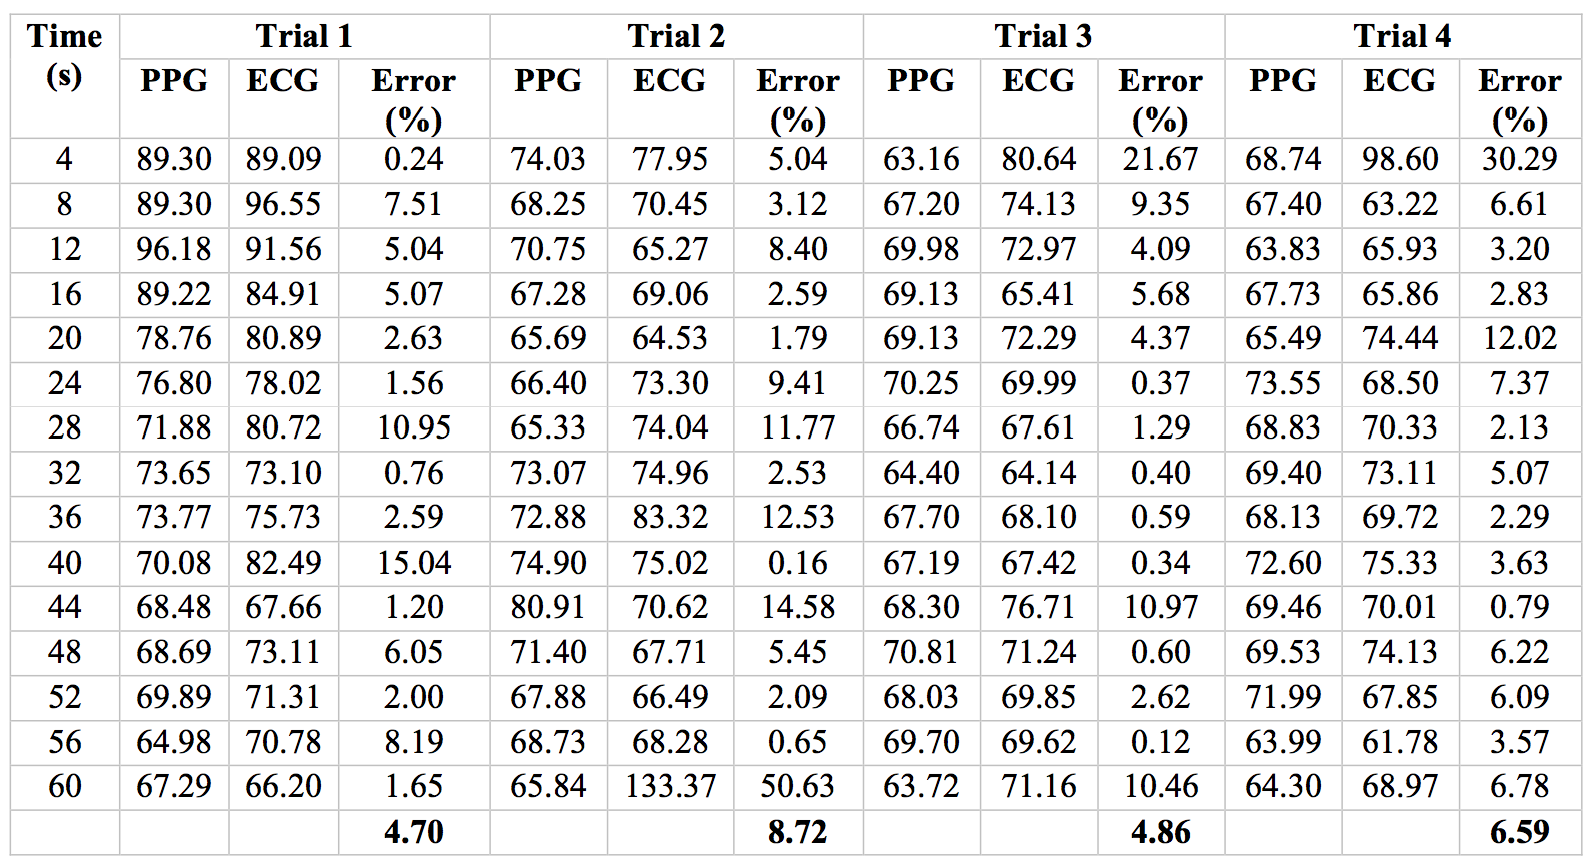
The short time interval comparison took place in the Southampton General Hospital. Four trials were conducted each worth 1 minute data, taking average bpm every 4 seconds. The innacuracy of our probe and the ECG was ±6.2 %, which is much higher than the short time interval comparison due to a number of sources of error. Firstly, the two systems were recording in parallel but there is always a time error when the two users started each system respectively. In addition, in each trial the user had to start the PPG sensor recording which lead to movement and hence leading to corrupted signals being obtained. Finally, as observed from the clinical technician in the hospital the PPG signals were not that strong due to de-hydration and low body temperature of the subject.

Table 2: PPG and ECG beats per minute values including inacuracies for four trials worth one minute data
Overall, our device is accurate for longer time measurements but not for beat to beat as concluded from the assessment with the ECG unit. More specifically, our probe fails to detect rapid spikes in the hearbeat in comparison with the ECG. This is due to the fact that our signal is very weak (micro volts) whereas the ECG has an amplifier and the value of the voltage variations are of a 0.1V magnitude. Bear in mind that all filtering and processing in our sensor is done 100% digitally and no alrgorithm is implemented to tackle motion induced artifacts.
Future works:
- Implementing algorithms to tackle motion induced noise (could equipe the sensor with a 3-axis accelerometer)
- Utilizing more than one light source for different skin colours and to also obtain further physiological data such as blood oxygen saturation
- Create a 3D printed casing that will protect the sensor from ambient light and reasure optimal contact pressure between the probe and the user's skin tissue
Attach Poster
Both poster and project report are attached below.
Nominate Your Professor
I would like to express my sincere gratitude to my supervisor Dr Laila Dina Shona for the continuous support, guidance and motivation she offered me during my dissertation. The quality of project would have been greatly diminished without her guidance and continuous support.
I would like to nominate my tutor and supervisor Dr Dina Laila Shona who is currently a lecturer in the Electro-Mechanical Research Group in the University of Southampton. She is an academic that aims to teach control theory to her students through interesting laboratories inlcuding practical implementations of Control Theory. One of those control labs, involved hands on experience with myRIO, LabVIEW and the QUBE-Servo. Not only does Dr Dina make classical control design more interesting and fun, but she constantly helps and pushes her students to get hands on experience with commercial software and hardware packages such as those of National Instruments. In addition to that, she has arranged several times with National Instruments, LabVIEW seminars in-campus to take place, so that students can learn and get exposure to tools that current engineers must be familiar with.
Further information and contact details can be found in the link included:
http://www.southampton.ac.uk/engineering/about/staff/dl2a10.page#background
