- Document History
- Subscribe to RSS Feed
- Mark as New
- Mark as Read
- Bookmark
- Subscribe
- Printer Friendly Page
- Report to a Moderator
- Subscribe to RSS Feed
- Mark as New
- Mark as Read
- Bookmark
- Subscribe
- Printer Friendly Page
- Report to a Moderator
Purpose:
This tutorial shows how to make a simple respiration monitor with the myDAQ or ELVIS II series in conjunction with LabVIEW.
Purpose:
Use signal transduction and data acquisition concepts to implement a real-life medical application.
What you need:
- NI myDAQ or NI ELVIS II series
- NI LabVIEW
- At least 2 feet of wire
- Protoboard
- 180 kΩ resistor
- Solder/soldering iron
- Thoracic transducer belt (e.g. belt or band tight around waist)
- Force sensing resistor (#1027-1001-ND from Digikey or equivalent)
Background:
The application demonstrated in this tutorial uses a force sensing resistor (FSR) to transduce the expansion of the user’s diaphragm to an electrical signal. Our FSR, seen here, will vary its resistance depending on how much force is being applied to the sensing area. The harder the force, the lower the resistance. This FSR can sense applied force anywhere in the range of 100g-10kg. Click here for more information about sensors and signal transduction.
Set Up Hardware:
Solder two wires to the FSR—one to each terminal. The wires should be fairly long (at least 1 foot each), as they will need to connect the pressure sensor from under your belt to the protoboard. Build the circuit on the protoboard, and wire it to the myDAQ as shown below. If the ELVIS II is being used, all of the same ports can be used.

Figure 1: NI myDAQ Wiring Diagram
*Note: Red wires are directly attached to a power source, brown wires are directly attached to ground, and blue wires are directly attached to neither.
Software Instructions:
LabVIEW User Interface
The user interface of ‘respiration monitor.vi’ displays the respiration (force) data as a function of time, and the approximate peak of each breathing cycle. The user inputs his/her age range, and the program indicates whether the respiration rate is higher than, lower than, or equal to the average respiration rate of that age group. The user interface also allows the user to select whether the instrument is being used during exercise or not. Choose ‘Normal’ to provide optimal functionality with normal breathing rates, and choose ‘Exercise’ to provide optimal functionality with higher breathing rates. Note that if ‘Exercise’ is chosen, the program will not indicate whether your breathing rate is higher than, lower than, or equal to the average respiration rate. The interface gives the user the option to write the data to a measurement file (.lvm) or not.

Figure 2: LabVIEW Front Panel
Coding Strategy
The basic coding strategy for our program is shown below. For a more detailed description, check out the block diagram of ‘respiration monitor.vi.’

Figure 3: 'respiration rate.vi' coding diagram
The coding diagram was implemented as the LabVIEW block diagram shown below.
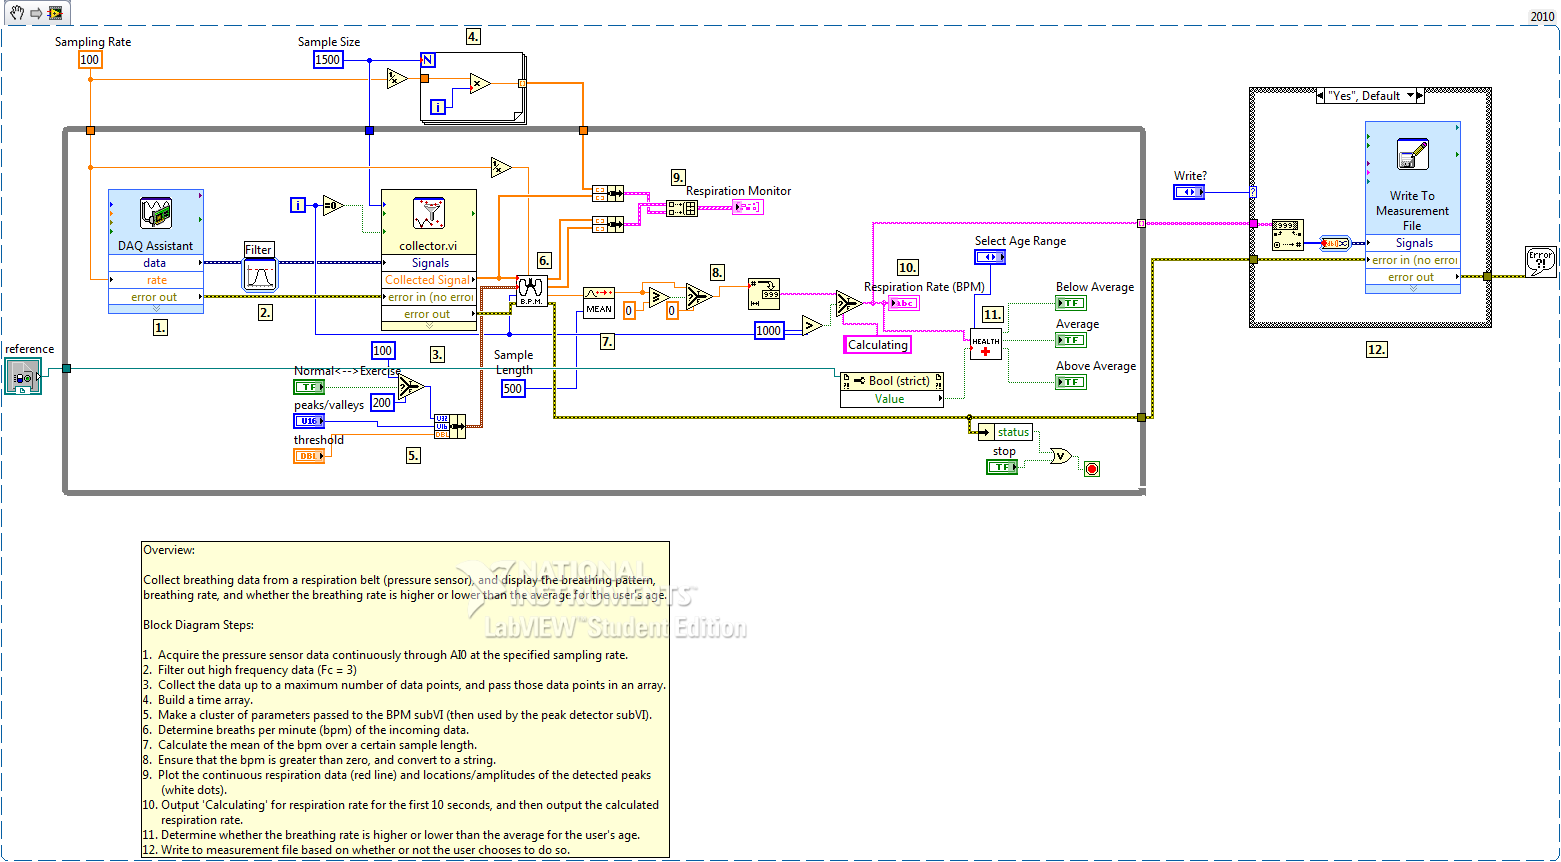
Figure 4: 'respiration monitor.vi' block diagram
*Note: The DAQ Assistant must be configured to your specific device.
How It Works:
The application demonstrated in this tutorial uses a force sensing resistor (FSR) to transduce the expansion of the user’s diaphragm to an electrical signal. The force readings are sent to the myDAQ or ELVIS II, which in turn are sent to LabVIEW for processing and display. The application can be outlined as follows:
- An FSR is secured (possibly with tape) to the inside of a belt/band.
- The FSR is connected to the myDAQ or ELVIS II as described in the ‘Wiring Instructions’ section.
- The belt/band is secured tightly around the diaphragm (mid-waist) of the user.
- The myDAQ or ELVIS II is connected to a PC, and the LabVIEW program ‘respiration monitor.vi’ is run.

Figure 5: Data flow for our application
Tips and Tricks:
- If the signal is not being picked up well, try tightening the belt and/or moving it higher or lower on your midsection.
- After writing the measurement file, you can open it in an Excel spreadsheet. Simply open the file with Excel, and use the default settings for the Text Import Wizard.
- Try different sensors for transducing the diaphragm expansion to a proportional electrical signal, such as flex sensors or pressure sensors. Many respiration monitors actually use an air pressure sensor in conjunction with inflatable belts.
Webcasts, Tutorials, and Other How-To Resources
Learn About Relevant Training Options: Data Acquisition and Signal Conditioning
Applications Engineering
National Instruments
