- Document History
- Subscribe to RSS Feed
- Mark as New
- Mark as Read
- Bookmark
- Subscribe
- Printer Friendly Page
- Report to a Moderator
- Subscribe to RSS Feed
- Mark as New
- Mark as Read
- Bookmark
- Subscribe
- Printer Friendly Page
- Report to a Moderator
Spirometer:
Characterization of Lung Function
Rebecca Rabban, Joanna Salacka, Roy Zhang
INTRODUCTION
The project objective was to build a spirometer to successfully characterize lung function. A spirometer measures
volumetric airflow in and out of lungs and allows the diagnosis of lung diseases, such as asthma, which currently
affects 300 million people worldwide. Potentially fatal respiratory diseases, such as chronic obstructive
pulmonary disease and cystic fibrosis, can be detected and their treatment responses tracked. Additionally,
spirometer assists respiratory exercises, which are especially important after surgery or prolonged bed rest to
prevent lung collapse and pneumonia.
The device consists of a tube with two different cross-sectional areas, with the user exhaling into one end of the
tube. The design is based on the Venturi effect, which describes how volumetric air flowing through a tube
remains constant, air velocity increases as it moves into the tube with smaller cross-sectional area to create a
pressure difference. This differential is converted to volumetric flow rate by LabVIEW using the Bernoulli’s
principle. Other parameters to be analyzed include Peak Expiratory Flow (PEF), Forced Vital Capacity (FVC),
and Forced Expiratory Volume in 1 Second (FEV
1). PEF, in liters per second, is the maximum flow rate achieved
by forced exhalation after a full inhalation. FVC, in liters, is the maximum volume forcibly expelled after full
inspiration. The third parameter, FEV
1, is the maximum volume of air that can be forcibly blown in the first
second.
EXPERIMENTAL SETUP
Our system is composed of a flow transducing device (Venturi tube), differential pressure sensor, conditioning
circuits and LabVIEW VI. The pressure sensor measures the difference in pressure between sections of the
Venturi device and outputs a voltage proportional to this difference, in the 20 mV-50mV range. The conditioning
circuits consist of a differential amplifier with a gain of 100 and a low-pass filter with a 3dB rolloff at 26 Hz.
These circuits serve to increase the signal magnitude to the volt scale and filter out high-frequency noise
(especially 60 Hz noise). The frequency spectrum of interest for spirometry is typically 0-20 Hz.
We calibrated our sensor and signal conditioning circuits as a single system in order to obtain an equation for
conversion of voltage output to measured pressure difference. We accomplished this by applying a range of
known pressures to the sensor, using a pump and manometer from a blood pressure cuff, and recording the circuit
output.
The conditioned signal is acquired and analyzed by our LabVIEW VI. The data acquisition portion of the VI reads
the voltage data and converts the values to pressure difference using our calibration equation and then converts
the pressure difference to volumetric flow rate (Q) using the theoretical relationship above. Once a measurement
is complete, the analysis portion of the VI integrates flow for the entire data set to obtain volume vs. time and
flow vs. volume. It also calculates the parameters PEF, FVC, FEV
1 and FEV1/ FVC. The VI front panel displays
these parameters as well as graphs of the volume data.
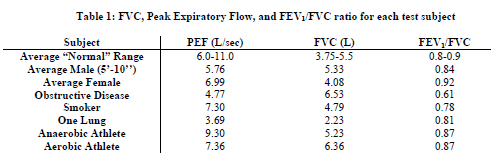
RESULTS
Appendix A shows an example of the waveform results from the front panel of our VI. This specific result is for
our “anaerobic athlete” test subject. Table 1 summarizes our results for each test subject.
We were able to obtain valid physiological values for PEF, FVC, FEV
1, and the ratio between FEV1 and FVC.
We also saw expected trends between subject types with 2 exceptions. The obstructive disease subject’s FVC was
greater than that of our average male subject, although we had expected it to decrease. This is most likely because
the subject was seven inches taller than the average subject. We had also expected the smoker to have a lower
PEF than average, but his peak was actually greater. We are unsure of the reason for this; it is possible that his
lungs are not severely affected by smoking, since he began smoking recently.
Each subject performed a minimum of 3 trials and the device was able to produce similar results for each trial. In
addition we are able to obtain consistent results over multiple days. We consider the device an acceptable proof of
concept because it obtains expected physiological values and can differentiate between a normal and abnormal
lung.
DISCUSSION AND CONCLUSION
Our project was to build and test a proof-of-concept prototype of a low-cost spirometer. We have concluded that
our system is an acceptable proof-of-concept; although additional improvements and tests would be desirable, we
have shown that such a system is indeed feasible.
The primary source of error in our system was the lack of calibration of the Venturi device itself. We are
confident in our calibration of the electronic sensor and circuitry, but for full accuracy the flow transducing device
should also be calibrated with a known flow source to determine if and how the conversion from flow rate to
pressure difference varies from the theoretical equations. If this effect turned out to be significant, some
adjustments to the device would be needed in order to bring it closer to ideal behavior. Possible parameters to be
adjusted include: tube lengths, location of pressure sensing points, length of hose connecting these points to the
sensor port and funnel design. We also discovered that the sensor output varied with supply voltage, which could
affect our system calibration, so a DC voltage regulator would be useful for powering the differential pressure
sensor.
APPLICATION
A functionality that could be added is a disposable or reusable mouth piece, which grants health care
professionals added assurance of patient health and safety by minimizing disease transmission. This can be done
by covering the inlet opening on the spirometer with an easily replaceable piece of tubing. Additional
functionality added to the system would be having ability in LabVIEW to email spirometer test results directly to
health care providers, who analyze the results and record them for disease or recovery progress tracking. This
increases productivity and sources of revenue by allowing for greater patient outreach. In addition, patients
benefit by eliminating the need to travel to a health clinic to receive care. Also, it saves time and effort being able
to send test results directly instead of fumbling with an extra email client. This functionality can be implemented
by placing a SMTP Email Send Message VI on the LabVIEW block diagram, which would have a case that when
executed, sends email with pertinent data to a list of email recipients at the user’s discretion.
Attachment: Original Report
- Mark as Read
- Mark as New
- Bookmark
- Permalink
- Report to a Moderator
Sir, how to make a vi for extraction respiration rate from ecg signal using DWT
