- Document History
- Subscribe to RSS Feed
- Mark as New
- Mark as Read
- Bookmark
- Subscribe
- Printer Friendly Page
- Report to a Moderator
- Subscribe to RSS Feed
- Mark as New
- Mark as Read
- Bookmark
- Subscribe
- Printer Friendly Page
- Report to a Moderator
Virtual Barometer
by
Lau Chai Ying, Student
Teh Foong Li, Student
Rodney Tan, Advisor
UCSI University
Malaysia
Products Used:
1. NI WLS 9163
2. NI cRIO 9215
3. NI LabVIEW 8.5
The Challenge:
Raining causes many troubles, and inconveniences to our activities. In order to avoid having activities or any inconveniences on rainy days, prediction on the coming weather is necessary. Weather forecasting is able to be made by referring to the rate of change in atmospheric pressure over a certain period of time. For this purpose, Virtual Barometer is designed as a device to forecast weather for the next few hours.
The Solution:
NI Wi-Fi DAQ unit which consists of NI WLS 9163 unit, and NI cRIO 9215 unit acts as the brain of the entire system. An integrated silicon pressure sensor, MPXA4115AC6U series is connected to NI cRIO 9215 unit. NI cRIO 9215 unit receives the signal from pressure sensor, while NI WLS 9163 unit provides the wireless connectivity to send the data to our computer. The flexibility of wireless enables the placement of the pressure sensor in outdoor while the data can be received in indoor within the range of coverage. The signal is then being analyzed by LabVIEW 8.5 programming to give us the weather forecast results. With the flexibility of LabVIEW 8.5 graphical programming, the results of weather forecasting can be shown in the virtual instrument on computer screen.
Abstract
Virtual Barometer is a device which is able to perform weather forecasting. There is an integrated silicon pressure sensor, MPXA4115AC6U series to detect the pressure of the air. It is connected to NI Wi-Fi DAQ to collect the value of barometric pressure for a period of time. The collected data is analyzed by comparison and mathematical relationship between atmospheric pressure and voltage. Based on the rate of the changes in pressure over a period of time, Virtual Barometer allows the user to predict the weather for the next few hours.
Introduction
Rain causes flood, big traffic jams, landslides, accidents, and many other inconveniences. For the sake of safety as well as to avoid these inconveniences, a system must be developed. Changes in atmospheric pressure are on of the most commonly used ways to forecast the changes in weather. This is due to the weather patterns are carried around in regions of high and low pressure. According to the researches done by meteorologists, decreasing atmospheric pressure indicates storms, rain, and windy weather. Meanwhile, rising atmospheric pressure indicates fair, dry, and colder weather.
System Overview
The system overview of Virtual Barometer is shown in Figure 1. The system consists of integrated silicon pressure sensor MPXA4115AC6U series, and NI Wi-Fi DAQ unit (NI cRIO 9215 unit, and NI WLS 9163unit).

Figure 1: Virtual Barometer System Overview Diagram
Virtual Barometer’s pressure sensor detects the atmospheric pressure and outputs the signal in voltage form. MPXA4115AC6U series is able to read the atmospheric pressure from 15 kPa/ 112.528 mmHg up to 115 kPa/ 862.716 mmHg, with an output range from 0.2 V to 4.8 V. 5 Volts is needed to power up the pressure sensor. Output from the pressure sensor will be sent to NI cRIO 9215 unit, connected to NI WLS 9163 which provides the wireless connectivity to send the data to our computer. NI Wi Fi DAQ unit is used to acquire the changes in voltage produced by pressure sensor. The data that have been collected will be display in the front panel of Virtual Barometer virtual instrument. By using LabVIEW 8.5, the collected data is analyzed by mathematical formulas and comparison to perform the weather forecasting.
Result and Discussion
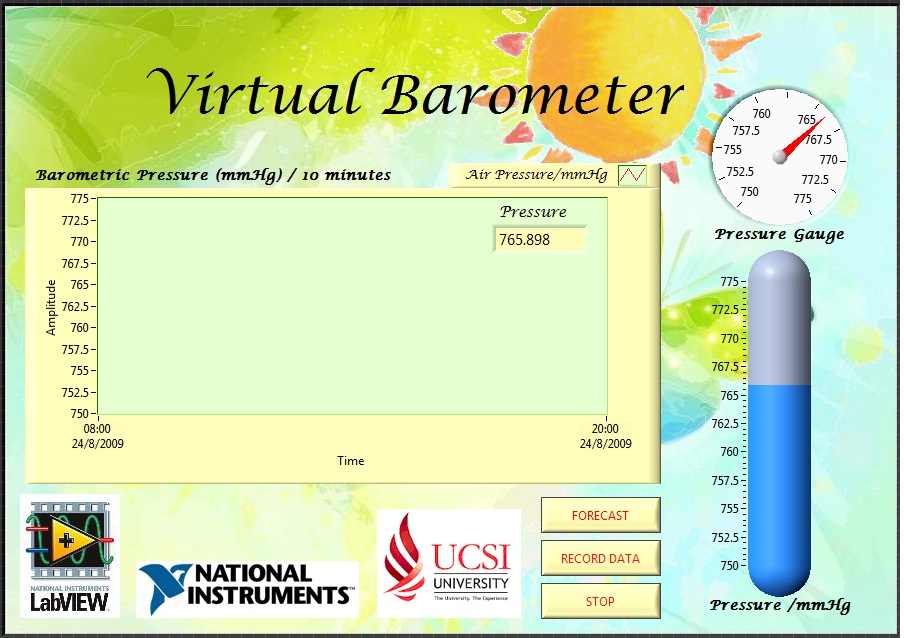
The user interface of Virtual Barometer in virtual instrument LabVIEW 8.5 is shown in figure 2.

Figure 2: Virtual Instrument User Interface of Virtual Barometer
The user interface of Virtual Barometer virtual instrument shows a waveform chart, pressure gauge, bar, picture ring and three buttons. The waveform chart displays the changes of atmospheric pressure of a period of time. Data is taken for every 10 minutes in order to plot the chart. There are pressure gauge and pressure bar, which show us the value of the current atmospheric pressure. On the other hand, there are three buttons having different functionality. The “FORECAST” button shows user the result of weather forecasting through a picture ring. The picture ring is used as the background of the virtual instrument. If a fair weather is predicted, the background would change to a sunny view. Reversely, if a raining is predicted, the background would change to a rainy view. The “GET DATA” button would save the value of the atmospheric pressure at the particular moment to a file allocated by the user. Lastly, the “STOP” button stops the functionality of the virtual instruments.
By carefully observing the pressure on the waveform chart, local weather can be forecast using these simple guidelines as shown in table 1.
Condition | Rate of change in atmospheric pressure (mmHg/3 hours) | Weather Forecast |
Pressure Drops | < 0.8 | Steady |
0.8 to 2.0 | Short lasting wind and showers | |
> 2.0 | A storm is likely in 5 to 6 hours | |
large, slow and sustained | Long period of poor weather | |
Pressure Rises | < 0.8 | Steady |
0.8 to 2.0 | Poorer weather | |
> 2.0 | Short period of fair weather | |
large, slow and sustained | Long period of fair weather |
Table 1: Relationship between the weather, and the change in atmospheric pressure over 3 hours
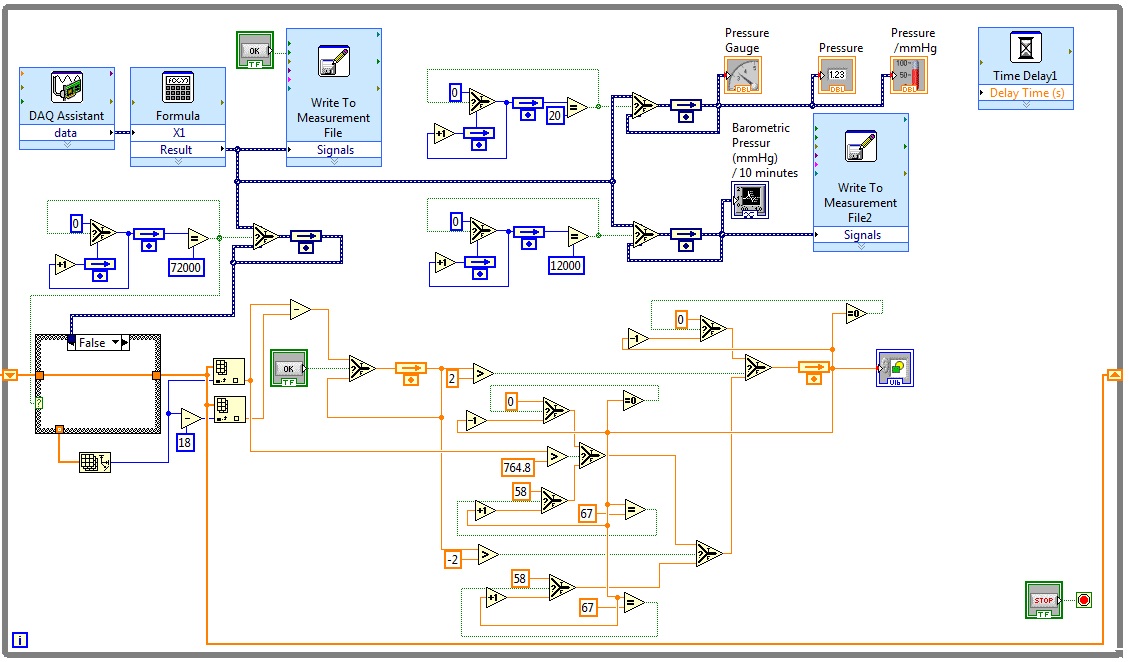
The relationship of the weather, and the change in atmospheric pressure is compared. Figure 3 shows the LabView software programming block diagram of Virtual Barometer.

Figure 3: LabVIEW Software Programming Block Diagram of Virtual Barometer
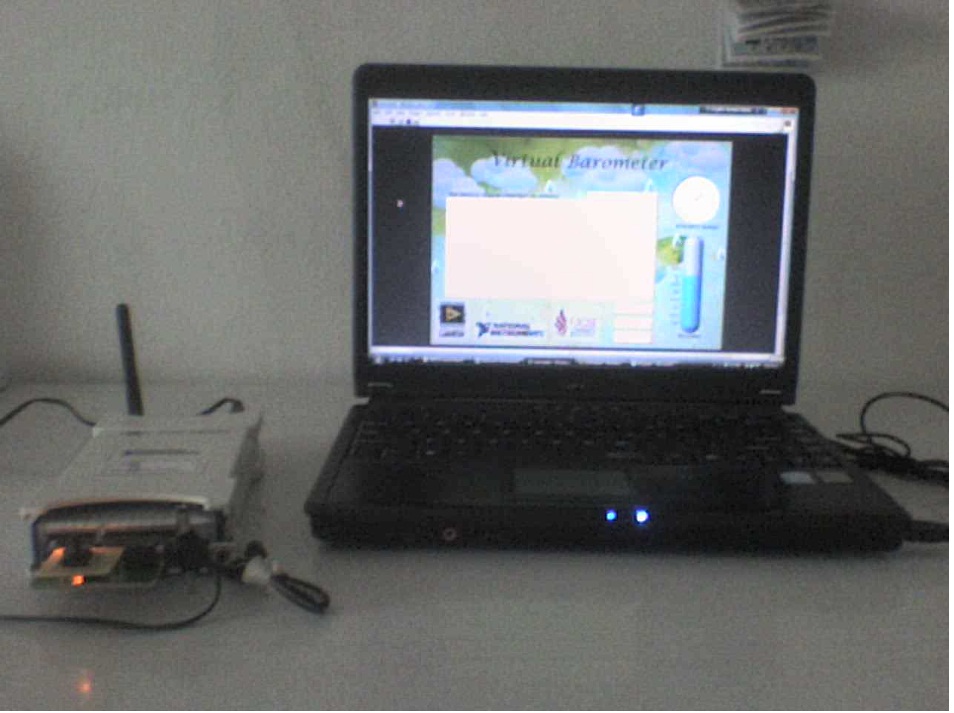
In order to get the more accurate data and results, NI Wi-Fi DAQ unit is placed in outdoor on a wide empty space. A power supply adapter and pressure sensor MPXA4115AC6U series are connected to the printed circuit board which will be connected to NI cRIO 9215 unit. The results will be shown on the computer through virtual instrument without the need of connecting our computer to the NI Wi-Fi DAQ unit. The complete system is shown in figure 4.

Figure 4: Virtual Barometer Virtual Instrument Experiment Setup
Conclusion
The Virtual Barometer virtual instrument is used to demonstrate the local weather forecasting for the next few hours. NI Wi-Fi DAQ and LabVIEW 8.5 software were successfully utilized in the Virtual Barometer project. NI Wi-Fi DAQ has brought us many conveniences in collecting data and results by referring a relationship between weather and the changes in pressure over a period of time.
For more information, contact:
Rodney Tan
Senior Lecturer
UCSI University, Malaysia
Lot 12734, Taman Taynton View, 56000 Cheras, Kuala Lumpur, Malaysia
Tel: +6017-3078955
Fax: + 603-91023606
Email: rodneyt@ucsi.edu.my
