- Document History
- Subscribe to RSS Feed
- Mark as New
- Mark as Read
- Bookmark
- Subscribe
- Printer Friendly Page
- Report to a Moderator
- Subscribe to RSS Feed
- Mark as New
- Mark as Read
- Bookmark
- Subscribe
- Printer Friendly Page
- Report to a Moderator
Introduction
You may or may not know already, but us interns at National Instruments get to devise and create our own myDAQ project. We're given a week, and time off of our usual job to focus solely on the project. We're given an open specification; in other words, we can create whatever we like, providing it illustrates some concept and/or is a cool demo of the myDAQ.
For my project, I decided to create myE-Field. The idea for this came from a 4 hour lab session I had to do in my first year of my degree. This lab session involved sitting at a desk, for with a pen and paper, a multimeter, and a huge plate of conductive glass with copper plates mounted on. As you can probably guess, the task was to use the multimeter to measure voltages at different points on the glass, taking note of each voltage.

The picture above shows the typical field that you'd expect to see, once all the measured voltages were plotted out.
Although this lab session was an good introduction to electric fields, measuring different points on a piece of glass for 3-4 hours isn't the definition of exciting
So, I decided to build an alternative!
Using some conductive paper, metal plates, some plastic (for a base) and a myDAQ of course, I've created a more automated, faster way of measuring a field that even provides a real time visualisation of the field as it is being measured. All controlled by LabVIEW and the myDAQ!
.png)
What I used
Here's a list of what I used to build myE-Field.
- NI myDAQ + screw terminal connector
- 1 DMM Probe
- Various sheets of perspex (specific information is in the attached tutorial)
- Aluminium (or any other conductive metal) plates
- LED
- Push button switch
- Conductive paper
- Conductive glue
- An assortment of wires and screws!
Video
See myE-Field in action!
Software
The software is built using a simple state machine architecture. Since the measurement follows a sequence of actions, I felt this was the best approach.
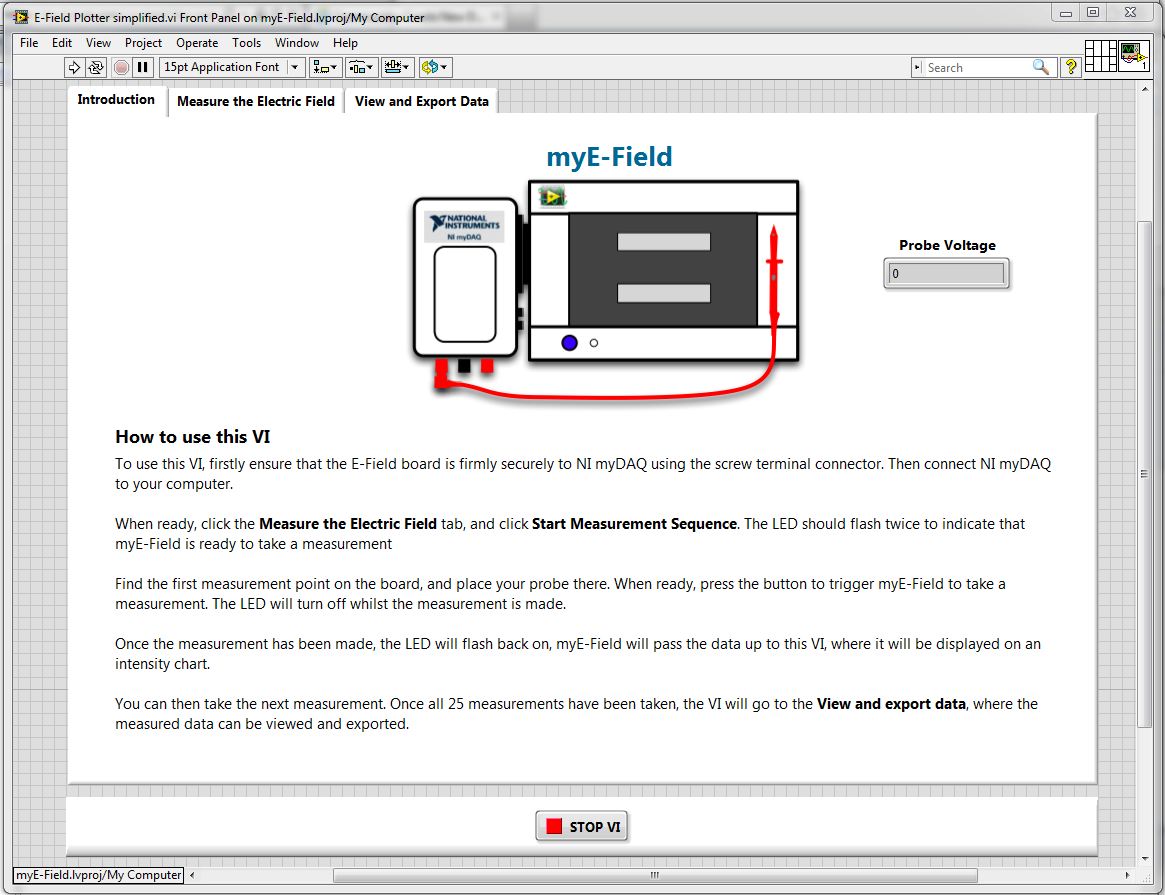
The front panel consists of a tab control to seperate each stage of the program. It also fits quite nicely into the state machine (each tab is a state) and means you can create front panels that aren't cluttered up with objects.
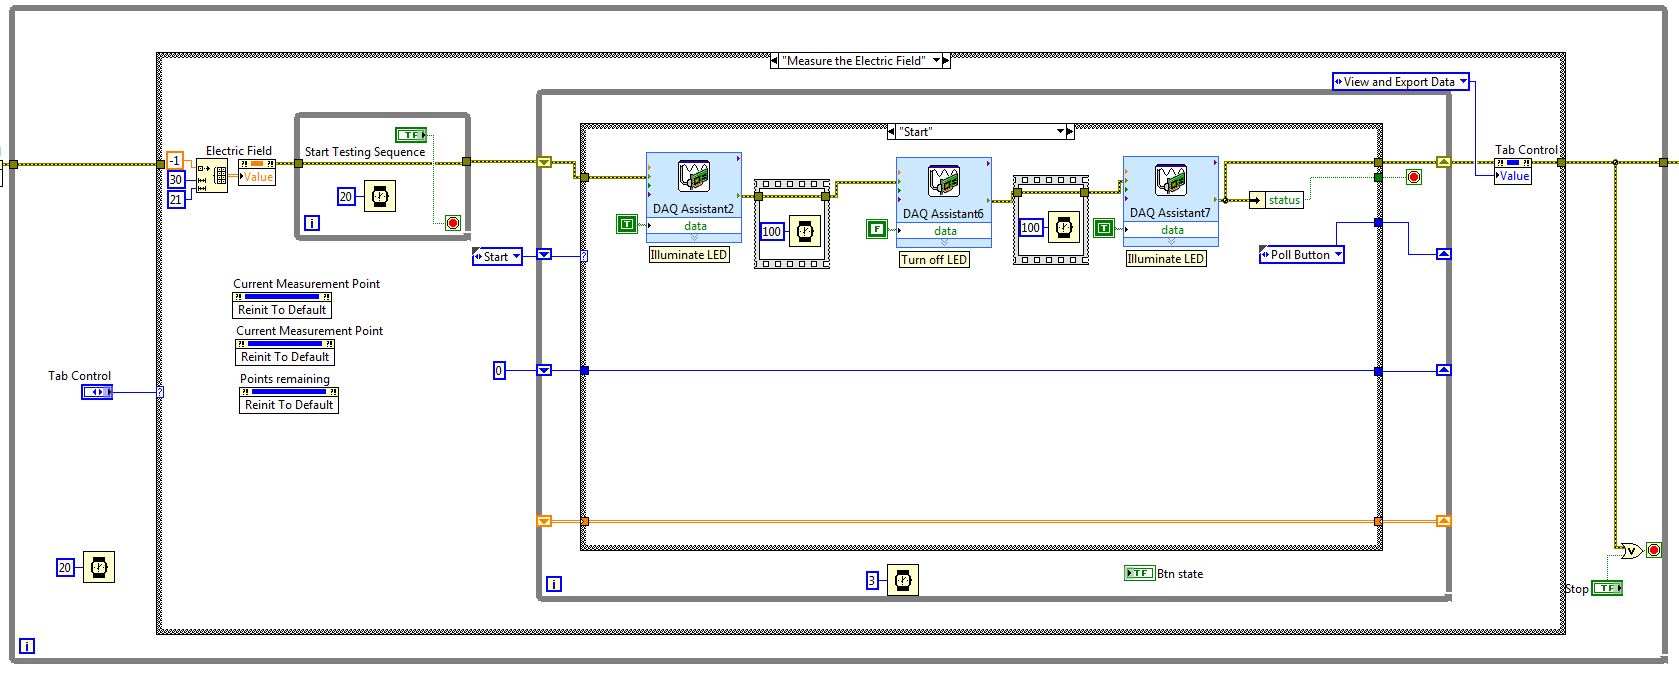
A simple state machine architecture is used to regulate and control the execution of the program. I wrote custom VIs that take a measurement point and translate it into the appropriate colour and position on a 2D Graph. This is how the 2D visualisation is built up.
Attached is all my code, along with a poster and a tutorial if you're interested in building your own myE-Field!
Applications Engineer
National Instruments UK & Ireland
- Mark as Read
- Mark as New
- Bookmark
- Permalink
- Report to a Moderator
Sounds great and I hope you have used intensity for the ease of understanding hats off for that...
- Mark as Read
- Mark as New
- Bookmark
- Permalink
- Report to a Moderator
Thanks a lot!
Applications Engineer
National Instruments UK & Ireland
- Mark as Read
- Mark as New
- Bookmark
- Permalink
- Report to a Moderator
this is wonderful. can we have the VI and the documentation to buit it for our classes?
thank you.
manolo
- Mark as Read
- Mark as New
- Bookmark
- Permalink
- Report to a Moderator
Thanks for your comment! The code and tutorial are available as downloads above. If you have any more questions I'm happy to answer them here for you 
Applications Engineer
National Instruments UK & Ireland
