- Subscribe to RSS Feed
- Mark Topic as New
- Mark Topic as Read
- Float this Topic for Current User
- Bookmark
- Subscribe
- Mute
- Printer Friendly Page
Problem with Blood Pressure Acquisition
05-13-2011 03:33 AM
- Mark as New
- Bookmark
- Subscribe
- Mute
- Subscribe to RSS Feed
- Permalink
- Report to a Moderator
Hi,
I actualy work on a medical demonstartor in LabVIEW.
I have a problem with my Blood Pressure acquisition with oscilometric method.
I use the Blood Pressure Sensor of Vernier (http://www.vernier.com/probes/bps-bta.html), a NI sbRIO 9602 and a NI 9205/9206 module.
I obtain the graph joined in the jpg file.
I don't see oscillations that permit to calculate my pressure.
Could you help me??
Regards,
Nicolas
Nicolas M.
National Instruments France
Journées Techniques LabVIEW 2012 : du 27 septembre au 22 novembre
2 sessions en parallèle : Débuter avec LabVIEW - Développer avec LabVIEW
05-13-2011 05:15 AM
- Mark as New
- Bookmark
- Subscribe
- Mute
- Subscribe to RSS Feed
- Permalink
- Report to a Moderator
Nicolas,
a typical beat-to-beat timecourse of blood pressure is given at http://de.wikipedia.org/w/index.php?title=Datei:Arterial-blood-pressure-curve.svg&filetimestamp=2010....
Your curve instead does not show any similarities with what is to be expected. I'd suggest to:
1. retrieve a curve with a zero signal in order to proove your data acquisition (DAQ)
2. Check the DAQ parameters; you would need at least ~ 100 S/s over (much) more than 2 seconds.
3. I do not know the sensor's signal level; your curve looks like recovering from saturation. Maybe you need to wait much longer between connection of the circuitry and starting the DAQ. Your screenshot does not help here as no units are given.
4. Try to use a different signal source; maybe your sensor is defective?
Adjust your parameters until you get a curve similar to what is expected.
05-13-2011 09:12 AM
- Mark as New
- Bookmark
- Subscribe
- Mute
- Subscribe to RSS Feed
- Permalink
- Report to a Moderator
Actually - I think the Nicolas is trying to use a non-invasive blood pressure cuff. The waveform looks correct - it shows the pressure inside the cuff as the pressure is slowly bled out after pumping up to approx. 200mmHg.
The signal of interest is hidden in that curve - you need to zoom way in and look carefully at the signal. As it approaches the normal systolic range (around 130mmHg) you should start to see small pulses on top of that descending curve - this is where the pressure is low enough that blood is starting to pulse through artery. You should continue to see these small pulses until finally the pressure is low enough in the cuff that it's not occluding the artery at all and there is no impact on the pressure in the cuff.
The key is to zoom way in on this curve or you won't see these small pulses!
05-13-2011 09:35 AM
- Mark as New
- Bookmark
- Subscribe
- Mute
- Subscribe to RSS Feed
- Permalink
- Report to a Moderator
I don't see the small pulses.
Lul, the signal I want to acquire it's like the joined file.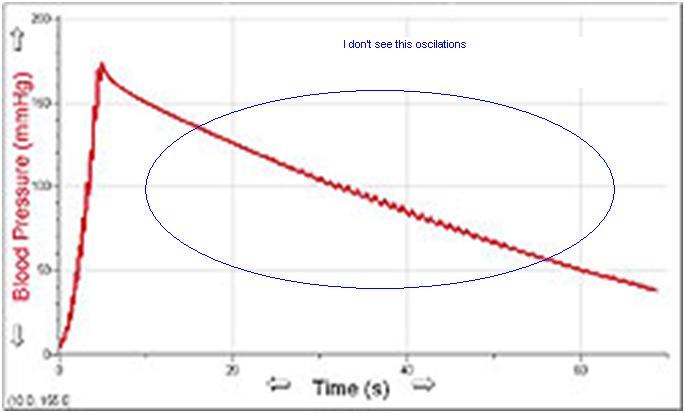
Nicolas M.
National Instruments France
Journées Techniques LabVIEW 2012 : du 27 septembre au 22 novembre
2 sessions en parallèle : Débuter avec LabVIEW - Développer avec LabVIEW
05-13-2011 09:46 AM
- Mark as New
- Bookmark
- Subscribe
- Mute
- Subscribe to RSS Feed
- Permalink
- Report to a Moderator
OK - so go back to basics and make sure that you can get a pressure signal from the cuff that is sensitive enough. Fill the cuff with some air and just tap on it with a finger while you maintain a moderate constant pressure in the cuff. Do you see the effect in your collected data? Also - is your timescale for deflating the cuff similar to that shown in the picture that you just posted (about 60 seconds for the complete deflation phase)?
05-13-2011 12:30 PM
- Mark as New
- Bookmark
- Subscribe
- Mute
- Subscribe to RSS Feed
- Permalink
- Report to a Moderator
hello
I was wondering if might add some additional comment to Nicolas's BP problem.
actually the aquisition curve you provided does indeed look like some of the information that a modern NBP monitor is looking at. It looks to me like the "cuff pressure step curve"
Actually modern NBP monitors are looking at usually two separate pressure transducers. One monitors cuff pressure and the other much more accurate one measures the tiny changes on each "step" in the cuff blood pressure signal.
As Steve.J. indicated, manufacturers are looking at tiny fluctuations on each "shelf" (each successive reduction in pressure).
I am paraphrasing a manufacturers manual here: "each step the pressure reduces, the more accurate pressure transducer is looking for two equal amplitude little blips in pressure. these blips represent two heart beats. They llok for two equal amplitude blips as a means of noise reduction. The monitor records these pressure levels. Then the pressure is released a little bit more and the it looks for two more little blips. The pressure keeps stepping down like this until it gets to some predetermined level. The cuff then deflates and the software in the monitor runs all those more accurate pressure values and the ocrresponding cuff step pressure values, and other things like atmospheric pressure, timing etc. through an algorithm and displays the various pressures on its display."
in the old days--ie. the eighties, manufactures used to publish their algorithms they used to calculate the actual displayed systolic, diastolic and mean pressures. Not any more. very secretive due to all sorts of patant issues I believe. I wish I had an old manual to find this but there gone.
I hope that helps explain it a bit.
andy
05-16-2011 09:57 AM
- Mark as New
- Bookmark
- Subscribe
- Mute
- Subscribe to RSS Feed
- Permalink
- Report to a Moderator
Hi,
Steve, i test my cuff and it detect little tap on it. I see small peaks on Labview. My time scale to deflating the cuff it's considerably lower than 60 seconds but my cuff is manually deflated.
regards,
Nicolas
Nicolas M.
National Instruments France
Journées Techniques LabVIEW 2012 : du 27 septembre au 22 novembre
2 sessions en parallèle : Débuter avec LabVIEW - Développer avec LabVIEW
05-16-2011 11:06 AM
- Mark as New
- Bookmark
- Subscribe
- Mute
- Subscribe to RSS Feed
- Permalink
- Report to a Moderator
Hm, lets summarize a bit:
1. You can detect the peaks caused by tapping on the cuff, so your DAQ is probably OK.
2. Your curve is divided into two parts, the constant part of 5.0 until about 180s, and the exponentially decreasing deflation part afterwards. Only the 2nd part contains the info you are looking for.
So I would revert the arrayorder and search for a value of, say 4.95. Use only the subarray BEVORE the index of the searched value. Revert again. Do an exponential fit of your data array (assuming a formula
of A(t)=A(0)*exp(t/tau). Substract the fitted data from your original data and you get the residual, which kind of 'amplifies' the oszillations you expect and which might or might not within your signal...
Here are some LabVIEW nodes you might consider helpfull: Use 'reverse array', than 'threshold 1D array'. Feed the
'fractonal index' output into the 'length' index of array subset and reverse thats output array. Use 'Build waveform' and feed this into the curve 'fitting' express vi, which shoud be configured like this:
* Model type 'Non-linear' with independent variable named 't'
* maximal 7 iterations
* 'Non-linear Model' is 'A*exp(t/Tau)
* Initial Guesses: A=5, Tau =40
Retrieve the residual and review that curve.
After your algorithm ran once you can as well adjust the parameters in the express VI with real data from the 1st run.
Keep us informed if possible...
Greetings from Germany!
--
Uwe
05-19-2011 07:37 AM
- Mark as New
- Bookmark
- Subscribe
- Mute
- Subscribe to RSS Feed
- Permalink
- Report to a Moderator
Hi,
I have resolved my problem. I deflated the cuff too rapidly. Now, I have my peaks when i deflate the cuff slowly.
Thanks a lot for your responses.
Regards,
Nicolas
Nicolas M.
National Instruments France
Journées Techniques LabVIEW 2012 : du 27 septembre au 22 novembre
2 sessions en parallèle : Débuter avec LabVIEW - Développer avec LabVIEW
