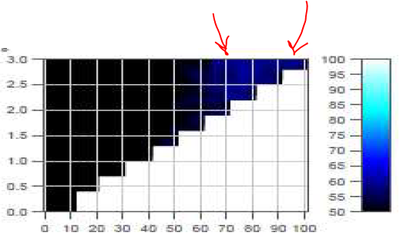
Hello! I'm struggling about the creation of a graph like this:

where in x-axis there is the time and in y-axis the succession of the brake stops divided by 10 (so they are 30 brake stops in blocks of three application that last for different times).
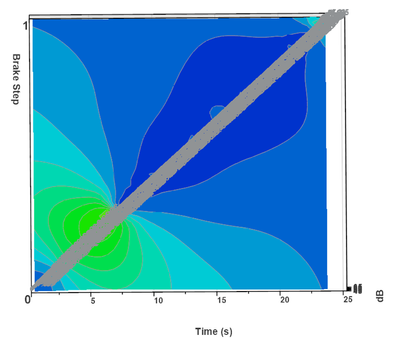
Then as you can see on top right there is a blue cloud for the dB. I honestly don't know how to realize it! I have tried with Contour in VIEW, with Waterfall and Surface but the best I have obtained FOR ONLY ONE BRAKE STOP is this (realized with characteristic diagram and by putting on y-axis a channel that has values from 0 to 1 with the same length of the time channel and dB channel):

The problem here is that it is "mirrored"... But I think that I just need to put the "dB flow" parallel to y-axis like in the reference graph... Please help me!