-
Analysis & Computation
307 -
Development & API
2 -
Development Tools
1 -
Execution & Performance
1,035 -
Feed management
1 -
HW Connectivity
115 -
Installation & Upgrade
269 -
Networking Communications
183 -
Package creation
1 -
Package distribution
1 -
Third party integration & APIs
294 -
UI & Usability
5,511 -
VeriStand
1
- New 3,108
- Under Consideration 5
- In Development 2
- In Beta 0
- Declined 2,642
- Duplicate 717
- Completed 342
- Already Implemented 114
- Archived 0
- Subscribe to RSS Feed
- Mark as New
- Mark as Read
- Bookmark
- Subscribe
- Printer Friendly Page
- Report to a Moderator
Benchmarking Probe
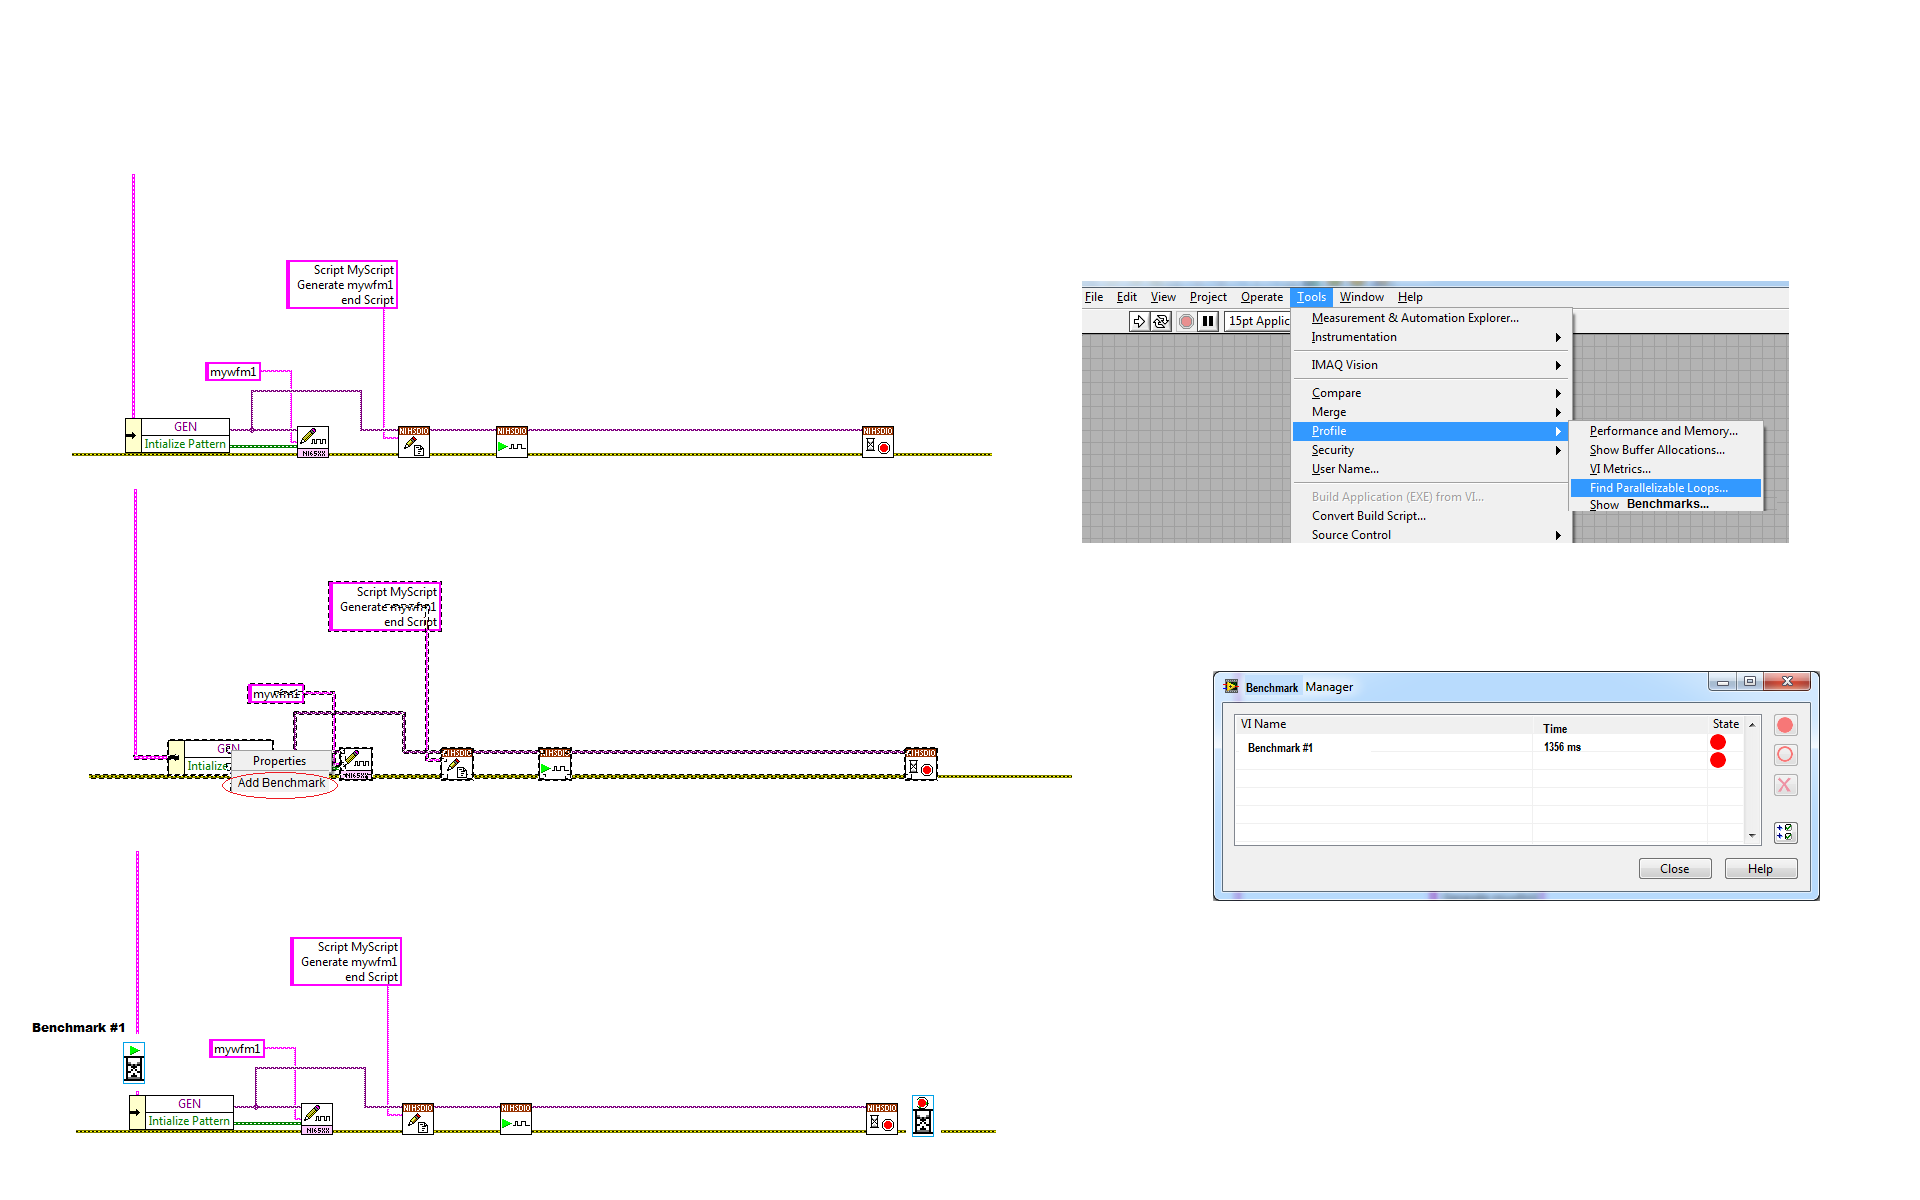
How many times have you created a sequence structure with two milisecond timers around a section of code to see how fast it operates. Now the VI Profiler works great if you are only looking at whole VIs, but there are lot of cases where that the VI level is not granular enough. A great feature would be a Benchmarking Probe. It would work similar to a Breakpoint. It would have a Benchmark Probe Manager similar to the Breakpoint Manager in which you can enable/disable/delet benchmarking probes (very useful when you need to quickly see if the benchmarking code itself is adding excessive overhead).
Unlike a breakpoint or a probe, it requires two icons a Start/Stop of where you want to take a measurement. I would imagine that there would be two ways to insert the benchmark probe, one method would be similar to how insert a Breakpoint (in fact you could simply use the breakpoint tool and just add a right click option to convert to a benchmark probe). Once you clicked on the Wire that you wanted to "Start" the benchmark, the mouse icon would change to a the "Stop" benchmark icon and you would choose the place to Stop the benchmark. Of course if those two points weren't "In Place" and "Sequential" with each other, LabVIEW wouldn't allow you to place it.
Another method could be simply highlighting the area of code you want to benchmark and then right-clicking on the hgihlighted section, you would get an additional pop-up menu item for adding a benchmark, this would automatically place the two benchmark icons.
The Benchmark manager would give options of viewing the Total Time, Average Time, number of Runs in miliseconds, microseconds,etc in addtion to being able to enable disable, delete benchmarks.
You must be a registered user to add a comment. If you've already registered, sign in. Otherwise, register and sign in.

