- Subscribe to RSS Feed
- Mark Topic as New
- Mark Topic as Read
- Float this Topic for Current User
- Bookmark
- Subscribe
- Mute
- Printer Friendly Page
CWGraph3D Solution
07-10-2008 02:41 PM - edited 07-10-2008 02:43 PM
- Mark as New
- Bookmark
- Subscribe
- Mute
- Subscribe to RSS Feed
- Permalink
- Report to a Moderator
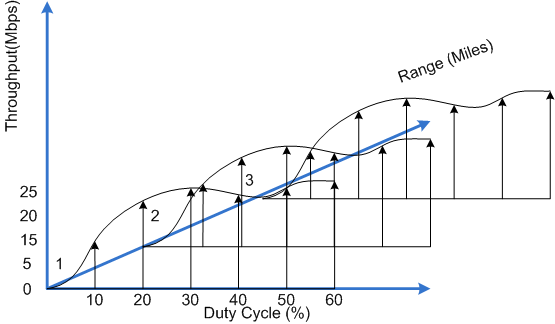
| DC | Range | Thoughput |
| 10 | 1 | 15 |
| 20 | 1 | 20 |
| 30 | 1 | 25 |
| 40 | 1 | 26 |
| 50 | 1 | 27 |
| 60 | 1 | 28 |
| DC | Range | Thoughput |
| 10 | 2 | 15 |
| 20 | 2 | 21 |
| 30 | 2 | 24 |
| 40 | 2 | 26 |
| 50 | 2 | 27 |
| 60 | 2 | 29 |
| DC | Range | Thoughput |
| 10 | 3 | 12 |
| 20 | 3 | 20 |
| 30 | 3 | 21 |
| 40 | 3 | 25 |
| 50 | 3 | 24 |
| 60 | 3 | 27 |
Message Edited by ShotSimon on 07-10-2008 02:43 PM
07-10-2008 02:54 PM
- Mark as New
- Bookmark
- Subscribe
- Mute
- Subscribe to RSS Feed
- Permalink
- Report to a Moderator
I'd us a parametric plot if you want a surface.
When working with paramteric plots you specify a set of points that are described by a triplet of X,Y,Z.
There is seperate array for the X values Y values and Z.
It wants a 2-d array so it knows which points to connect. Adjacent point will be connected.
If you just want three line, then use a unique plot number for each trace.
Ben
07-10-2008 03:05 PM
- Mark as New
- Bookmark
- Subscribe
- Mute
- Subscribe to RSS Feed
- Permalink
- Report to a Moderator
I put this worse case 3d plot example together in the hopes someone would learn from it some day (starts at reply #7). I am holding my breath that you may just be the one.
Have fun and please post some cool pictures.
07-10-2008 03:17 PM
- Mark as New
- Bookmark
- Subscribe
- Mute
- Subscribe to RSS Feed
- Permalink
- Report to a Moderator
07-10-2008 03:25 PM
- Mark as New
- Bookmark
- Subscribe
- Mute
- Subscribe to RSS Feed
- Permalink
- Report to a Moderator
Ben,
OK I never knew about the error stacker...Does that count? -SS
07-10-2008 04:41 PM
- Mark as New
- Bookmark
- Subscribe
- Mute
- Subscribe to RSS Feed
- Permalink
- Report to a Moderator
Ben,
I tried plotting my data from your example. I also tried to label the graph and nothing appears. What am I doing wrong? -SS
07-10-2008 06:18 PM - edited 07-10-2008 06:18 PM
- Mark as New
- Bookmark
- Subscribe
- Mute
- Subscribe to RSS Feed
- Permalink
- Report to a Moderator
I don't see where you are labeling anything.
Please save your data as the default so I can run your example.
Look closely and you will see a similar structure between how the code is written and the structure of the CW 3d graph propety screen.

If you can set it in the property screen you can set it programatically in a similar manner.
Ben
Message Edited by Ben on 07-10-2008 06:18 PM
07-11-2008 11:56 AM - edited 07-11-2008 11:57 AM
- Mark as New
- Bookmark
- Subscribe
- Mute
- Subscribe to RSS Feed
- Permalink
- Report to a Moderator
Ben,
Sry about the missing data...The problem was that visible was unchecked for the captions.. I saved my data (see attached) but I am having a hard time moving the axises such that (1) you can read everything, (2) the z-axis point diagonally into the page from front-bottom-left to rear-top-right.
I think I follow the CWPlot3D properties, it will take me some time to understand what they all do.
Regards,
-SS
Message Edited by ShotSimon on 07-11-2008 11:57 AM
07-14-2008 09:57 AM
- Mark as New
- Bookmark
- Subscribe
- Mute
- Subscribe to RSS Feed
- Permalink
- Report to a Moderator
Ben,
What do think I should do to make it look right? -SS
07-15-2008 07:51 AM - edited 07-15-2008 07:53 AM
- Mark as New
- Bookmark
- Subscribe
- Mute
- Subscribe to RSS Feed
- Permalink
- Report to a Moderator
Sorry SS,
Didn't realize I needed to reply. Well now it don't have all of the sub-VI's so all I can offer is "have you got your arrays wired to the proper inputs (X,Y,Z) ?"
If you switch to the operate tool you can then move your viewing angle. A shift drag will drag the graph inside the frame. A alt-drag will let you zoom in/out.
Ben
Message Edited by Ben on 07-15-2008 07:53 AM
