LabVIEW

cancel
Showing results for 
Search instead for 
Did you mean: 

Defer Panel Updates not working for XY graph

I am using an XY Graph in Labview 8.2.  I am making a lot of color changes and want to improve execution time by defering the panel updates while changing the colors.  I set the VI/Panel/DeferPanelUpdates to true and do the updates.  I can see the other controls on the panel are deferred, but the XY graph continues to redraw.  I can't see a way to defer the updates separately to the XY Graph.
 
I am only doing the defers for the color changes, if I defer the initial data input the color changes throw an error,
0 Kudos
Message 1 of 19
(4,937 Views)

Could you please post a simple example that demonstrates this behaviour?

Lacking the example I can only speculate that your data flow is not dictating the order of the operations.

Ben

Retired Senior Automation Systems Architect with Data Science Automation LabVIEW Champion Knight of NI and Prepper LinkedIn Profile YouTube Channel
0 Kudos
Message 2 of 19
(4,920 Views)
Here is an example, the loops just generate a  set of waves complex enough to show the behavior.  The sequence should control order of execution.
Message 3 of 19
(4,903 Views)

Thank you!

I call that a bug.

Nice Example*

I have posted this to the Bug Thread. I'll let you know if I come up with a work-around. This is a bummer.

Ben

*Initialiizing your SR's will make this run faster on subsequent runs.

Retired Senior Automation Systems Architect with Data Science Automation LabVIEW Champion Knight of NI and Prepper LinkedIn Profile YouTube Channel
0 Kudos
Message 4 of 19
(4,896 Views)

How about this for a work-around?

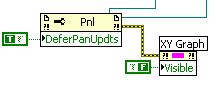
After defering the FP update, set the graph invisable then set the plot colors.

Prior to undefering, set the graph visable.

This works for me. Does it help your application?

Ben

Message Edited by Ben on 03-15-2007 06:00 PM

Retired Senior Automation Systems Architect with Data Science Automation LabVIEW Champion Knight of NI and Prepper LinkedIn Profile YouTube Channel
0 Kudos
Message 5 of 19
(4,894 Views)
That helps a lot.  It takes execution from about 16 seconds to 1 second.  It does leave a noticable blink, but that is a small price to pay for the time saved.
 
Maybe it is just late in the day, but what is the SR I should initialize?  I can't think of what SR means...
 
And definitely thanks for the 'visable' suggestion,  I thought I tried that by itself earlier, but got a fault when it tried to update the colors.  I don't remember the exact sequence.
 
Neil
0 Kudos
Message 6 of 19
(4,872 Views)

SR = Shift Regiters. On the second run the data from the first run is still in the SR.

Ben

Retired Senior Automation Systems Architect with Data Science Automation LabVIEW Champion Knight of NI and Prepper LinkedIn Profile YouTube Channel
0 Kudos
Message 7 of 19
(4,867 Views)
Thanks again.  And for anyone following the thread, I copied the graph and put the copy exactly behind the first graph.  That gets rid of the blink effect, it appears that the control goes blank instead of disappearing.
0 Kudos
Message 8 of 19
(4,835 Views)
Just one question. Is there a reason you create hundreds of plots to do this? It would be easier and faster to simply create 9 plots and bundle them correctly so the color update only takes a fraction of a second and wouldn't even be required since each of the 9 plots would already have a different color. Maybe your application requires all these plots, but the example that you posted could be created much more efficiently.
0 Kudos
Message 9 of 19
(4,826 Views)
Yes there is.  In the example I built something representative quickly and simply.  In my application I am graphing a plot of activations according to a script.  Each high and low may be different, and a new activation may erase part of an old one.  In addition some of the graph may be filled with a color, sometimes I have to change color rather quickly during a single activation.  These all require separate plots to make the fill work correctly.  Right now most of my time is already used doing the calculations to create the arrays an manage colors, to spent the time sorting them and chaining them together would use even more time.  I am actually plotting the same number or lines either way, it is only the colors that are a problem, and then only because the graph is redrawn with each color change. 
 
The Defer Panel Updates property was created for applications like mine.  Why not try to use it.
0 Kudos
Message 10 of 19
(4,813 Views)