- Subscribe to RSS Feed
- Mark Topic as New
- Mark Topic as Read
- Float this Topic for Current User
- Bookmark
- Subscribe
- Mute
- Printer Friendly Page
Digital Waveform with different color error indication (given Nth samples)
Solved!06-23-2008 10:51 PM - edited 06-23-2008 10:54 PM
- Mark as New
- Bookmark
- Subscribe
- Mute
- Subscribe to RSS Feed
- Permalink
- Report to a Moderator
Message Edited by engwei on 06-23-2008 10:52 PM
Message Edited by engwei on 06-23-2008 10:54 PM
Solved! Go to Solution.
06-24-2008 12:17 PM - edited 06-24-2008 12:17 PM
- Mark as New
- Bookmark
- Subscribe
- Mute
- Subscribe to RSS Feed
- Permalink
- Report to a Moderator
Tyring to change colors of individual samples on a digital graph is very difficult. I have never tried doing what your forum link was trying to do, but it might work for digital. Personally, I prefer to see a highlight around my bits that are in error. And adding highlights to a digital graph is alot easier than changing the plot colors on a sample by sample basis.
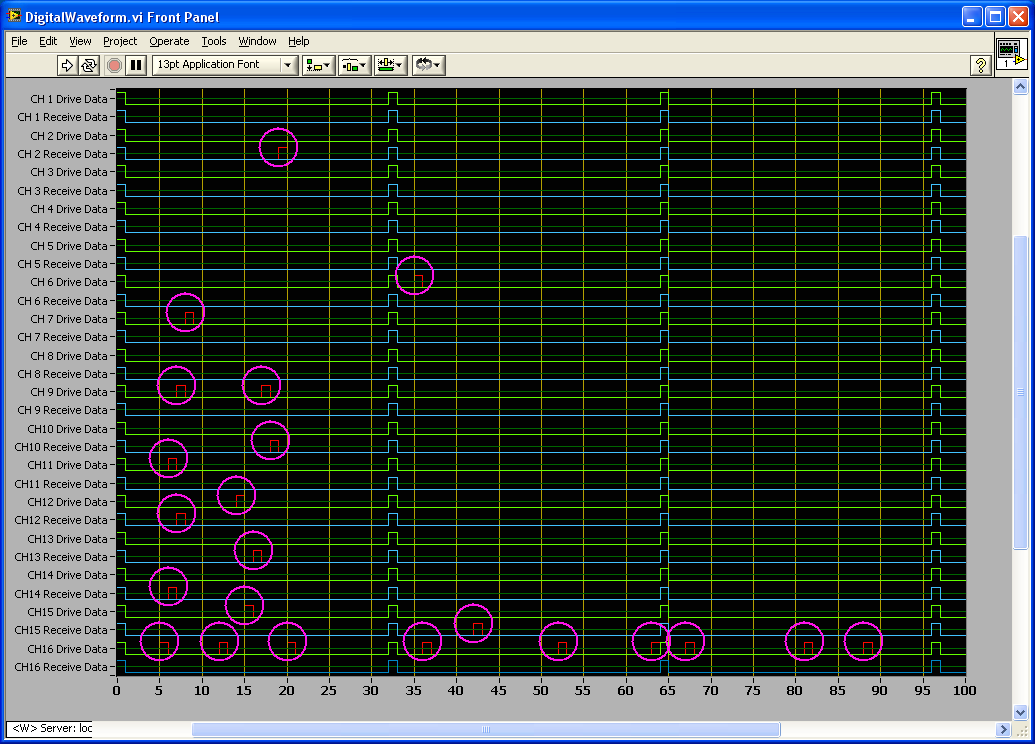
I've included a VI written in LV 8.5 that shows an example of how to highlight samples in a digital graph. This VI uses some method nodes that are only available in 8.5 so hopefully that is the version you are using.
In 8.5 you now have the ability to draw custom images in the plot area. I've written a VI that calculates the 4 coordinates for a rectangle that when drawn on the graph looks like a bit is highlighted. Give it a try and see if you can adapt it to your application.
Message Edited by JaredW on 06-24-2008 12:17 PM
06-24-2008 12:36 PM
- Mark as New
- Bookmark
- Subscribe
- Mute
- Subscribe to RSS Feed
- Permalink
- Report to a Moderator
This may be of interest.
Ben
06-24-2008 08:16 PM
- Mark as New
- Bookmark
- Subscribe
- Mute
- Subscribe to RSS Feed
- Permalink
- Report to a Moderator
