- Subscribe to RSS Feed
- Mark Topic as New
- Mark Topic as Read
- Float this Topic for Current User
- Bookmark
- Subscribe
- Mute
- Printer Friendly Page
Duplicating odd marker labeling on axis
11-08-2005 02:30 PM
- Mark as New
- Bookmark
- Subscribe
- Mute
- Subscribe to RSS Feed
- Permalink
- Report to a Moderator
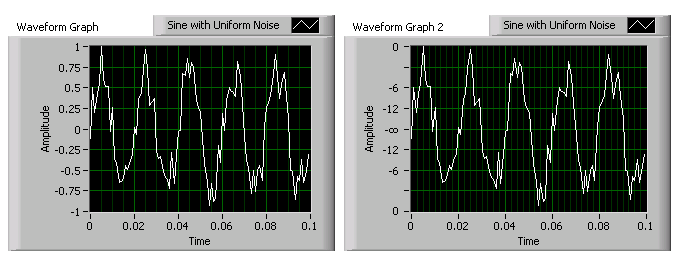
Plot A shows the Y-axis in volts. Obviously, this is no problem if array contains values in volts or voltage range is supplied along with relative values.
Plot B shows a normalized Y-axis from -100 to +100. I have no problem duplicating based on information from Plot A.
Plot C shows plot in terms of decibels. My first thought was to just convert values to dB using formula: 20*log(Array Value/ Array Max Value). Although correct in terms of converting values to dB, it does not provide the desired effect. Plot C really shows that at the 50% point, one is -6dB down from the max (with the max defined as 0 at the top of the plot). The negative portion of the axis labeling is handled similarly. Any ideas on how this might be done in LabVIEW.
Sincerely,
Don
11-10-2005 02:37 AM - edited 11-10-2005 02:37 AM
- Mark as New
- Bookmark
- Subscribe
- Mute
- Subscribe to RSS Feed
- Permalink
- Report to a Moderator
As far as I know you can't automatically setup the scale to fit the values that you want. This is simply because you can't calculate the logarithm of a negative number. However, the scale you want is actually a completely simple linear scale that goes from 1 to -1 but it's presented as the 20*log(|y|) where y is the value of the y axis (1 to -1). Since only the representation is changed, you can just remove the numbers from the scale and insert the "0", "-6", etc. strings instead. It will then look something like this:
Let me know if you have problems reproducing this customization.
Have fun!
Message Edited by Philip C. on 11-10-2005 02:37 AM
11-10-2005 10:29 AM
- Mark as New
- Bookmark
- Subscribe
- Mute
- Subscribe to RSS Feed
- Permalink
- Report to a Moderator
11-10-2005 03:17 PM
- Mark as New
- Bookmark
- Subscribe
- Mute
- Subscribe to RSS Feed
- Permalink
- Report to a Moderator
ps. or did you literally just create from 2d classic string indicators and recolor to match graph background?....Don
11-11-2005 12:58 PM
- Mark as New
- Bookmark
- Subscribe
- Mute
- Subscribe to RSS Feed
- Permalink
- Report to a Moderator
Hi Don,
All I did was choose the Y-scale style that doesn't have marker values and then
simply put free text labels at the appropriate places on the Graph. Don't use
String Indicators/controls unless you need to programmatically change the
strings while the IV is running. I then selected all the labels and the Graph
and grouped it all together, so they wouldn't move independently if dragged at
edit time.
Very simple indeed!
11-14-2005 11:05 AM
- Mark as New
- Bookmark
- Subscribe
- Mute
- Subscribe to RSS Feed
- Permalink
- Report to a Moderator
What font set did you get the infinity symbol from (and using what keystroke).
Property nodes can be used that will allow decorations to be visible or not visible, but how about for free text labels?
I need the ability to switch between the different Y-scales I mentioned earlier, and that entails making either graphs or decorations visible/invisible. Do you see where I am going with this?
Sincerely,
Don
11-14-2005 11:07 AM
- Mark as New
- Bookmark
- Subscribe
- Mute
- Subscribe to RSS Feed
- Permalink
- Report to a Moderator
ps. I see you addressed this already; yes that is why I originally thought of the string indicators because I do need to make visible / invisible programmatically. So I will use those. But again what keystroke and font (symbol?) did you use to get infinity?
Thanks again,
Don
11-14-2005 11:30 AM
- Mark as New
- Bookmark
- Subscribe
- Mute
- Subscribe to RSS Feed
- Permalink
- Report to a Moderator
11-15-2005 07:37 PM - edited 11-15-2005 07:37 PM
- Mark as New
- Bookmark
- Subscribe
- Mute
- Subscribe to RSS Feed
- Permalink
- Report to a Moderator
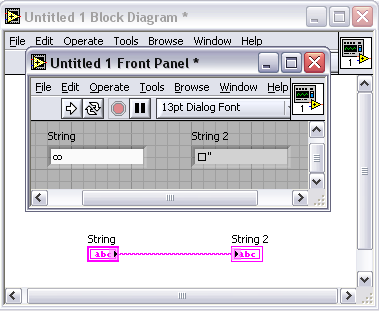
Good question about the ∞-sign. Well, I used the same procedure as I always use when using "weird" characters; open Microsoft Word, select "Insert » Symbol..." and then find your symbol among the many choices. The ∞-sign can be found used in many fonts under the Mathematical Operators category:

Notice that the symbol is unicode that we don't officially support, so you can't use it in owned labels, enums etc. Also, notice that if you use the value of the ∞-symbol as a string value, you will get in trouble when passing it to a string indicator (what did I just say; unicode is not officially supported in LabVIEW - I warned you, right?):
Well, I guess you can get some acceptable results if you don't pass the value to the indicators. And just a note; you CAN indeed get the reference to a free label and thereby control its properties - but it requires the use of VI Server which means a lot of additional programming for you. However, there are example programs out there that shows this feature if you are interested.
Have fun!
Message Edited by Philip C. on 11-15-2005 07:43 PM
11-16-2005 08:15 AM
- Mark as New
- Bookmark
- Subscribe
- Mute
- Subscribe to RSS Feed
- Permalink
- Report to a Moderator
Hi Phillip:
Thanks for your help on this one. Now that I know where to find infinity I should be all set. I'l figure out what the best way to display it is.
I know all about VI server, been using it for years to access/set control/indicator properties. And I believe I've used it to access visible/nonvisible property for decorations. Just was not sure one could do the same for free text labels so if I use those, I will figure out how to do this as well.
Thanks again,
Don
