Turn on suggestions
Auto-suggest helps you quickly narrow down your search results by suggesting possible matches as you type.
Showing results for
Topic Options
- Subscribe to RSS Feed
- Mark Topic as New
- Mark Topic as Read
- Float this Topic for Current User
- Bookmark
- Subscribe
- Mute
- Printer Friendly Page
GHART -X AXIS SCALE
Member
06-23-2008 06:35 AM
Options
- Mark as New
- Bookmark
- Subscribe
- Mute
- Subscribe to RSS Feed
- Permalink
- Report to a Moderator
Hello everybody,
I am using a waveform chart and I am trying to set the maximum value in x axis scale equal to 3000. However, after closing the properties window the value returns to 1023 (the auto scale is not selected). Is it something that I can do?
Best Regards
Knight of NI
06-23-2008 07:10 AM
Options
- Mark as New
- Bookmark
- Subscribe
- Mute
- Subscribe to RSS Feed
- Permalink
- Report to a Moderator
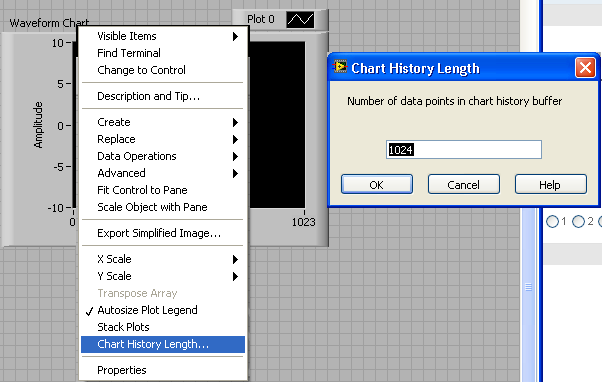
Right-click on the chart and select "Chart History Length..." at the bottom of the selections. Change it to 3000.
RayR
Knight of NI
06-23-2008 07:13 AM - edited 06-23-2008 07:13 AM
Options
- Mark as New
- Bookmark
- Subscribe
- Mute
- Subscribe to RSS Feed
- Permalink
- Report to a Moderator
The chart history is set to 1024 points by default. So you'll need to change the history to 3001 points to display 3000 on the x-axis scale.
See image below:
RayR
Message Edited by JoeLabView on 06-23-2008 08:13 AM
06-23-2008 08:48 AM
Options
- Mark as New
- Bookmark
- Subscribe
- Mute
- Subscribe to RSS Feed
- Permalink
- Report to a Moderator
Thank you very much.
Best Regards
Knight of NI
06-23-2008 09:17 AM
Options
- Mark as New
- Bookmark
- Subscribe
- Mute
- Subscribe to RSS Feed
- Permalink
- Report to a Moderator
Glad to help! 🙂
