- Subscribe to RSS Feed
- Mark Topic as New
- Mark Topic as Read
- Float this Topic for Current User
- Bookmark
- Subscribe
- Mute
- Printer Friendly Page
How to find time period in real time for a sine wave
08-15-2005 11:32 AM
- Mark as New
- Bookmark
- Subscribe
- Mute
- Subscribe to RSS Feed
- Permalink
- Report to a Moderator
08-15-2005 11:50 AM - edited 08-15-2005 11:50 AM
- Mark as New
- Bookmark
- Subscribe
- Mute
- Subscribe to RSS Feed
- Permalink
- Report to a Moderator
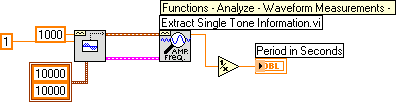
You can find the frequency by using the Extract Single Tone Information vi found in Waveform Measurements. If you still want the period, divide the frequncy into 1.
Message Edited by tbob on 08-15-2005 10:51 AM
08-15-2005 12:24 PM
- Mark as New
- Bookmark
- Subscribe
- Mute
- Subscribe to RSS Feed
- Permalink
- Report to a Moderator
Hi,
I tried that. But it gave me a very large fruquency like 4.9 E6... Let me explain the situation. I have a serial input through a device. The program in labview starts recording the data from the device. the device is then subjected to oscillations. That is when I want to find the frequency. When I tried the vi you suggested, the frequency didnt change I get data at the rate of 50 Hz. Its that at first there are no oscillation and then there are oscillations... and thats when I want to detect the frequency so that we can set the frequency to what we need.
08-15-2005 12:35 PM
- Mark as New
- Bookmark
- Subscribe
- Mute
- Subscribe to RSS Feed
- Permalink
- Report to a Moderator
08-15-2005 01:34 PM
- Mark as New
- Bookmark
- Subscribe
- Mute
- Subscribe to RSS Feed
- Permalink
- Report to a Moderator
08-15-2005 03:33 PM
- Mark as New
- Bookmark
- Subscribe
- Mute
- Subscribe to RSS Feed
- Permalink
- Report to a Moderator
08-16-2005 09:38 AM
- Mark as New
- Bookmark
- Subscribe
- Mute
- Subscribe to RSS Feed
- Permalink
- Report to a Moderator
Lynn
Mr. Lynn to tbob.
08-16-2005 09:59 AM
- Mark as New
- Bookmark
- Subscribe
- Mute
- Subscribe to RSS Feed
- Permalink
- Report to a Moderator
I do something similar in my belt tension tester program. Here's what I do:
1)find the impulse. I calculate the envelope of the signal. I find the start of the signal using a threshold value that the signal exceeds. The end of the impulse is when the envelope is lower than a pre-set lower threshold.
2)using the impulse start and stop locations I extract a sub array of data that contains only the impulse and not the background noise before or after the impulse.
3)FFT the sub-array
4)Find the largest peak location in the fft
5) take a sub-set of the fft data and Gaussian fit the sub array to get a peak location that is higher resolution than the number of fft bins.
6) use the Gaussian peak location to in spectral space combined with fft length and sample rate to calculate resonant frequency.
Here's a screenshot of the app that does the above calculations; note how similar our impulses are:
http://www.quadesl.com/labview/belt_tension_tester_2.1.gif
Sheldon
08-16-2005 11:29 AM
- Mark as New
- Bookmark
- Subscribe
- Mute
- Subscribe to RSS Feed
- Permalink
- Report to a Moderator
