- Subscribe to RSS Feed
- Mark Topic as New
- Mark Topic as Read
- Float this Topic for Current User
- Bookmark
- Subscribe
- Mute
- Printer Friendly Page
Is it true that the limit of the graph shown in the report VI is only limited to 0.1?
02-02-2006 02:34 AM
- Mark as New
- Bookmark
- Subscribe
- Mute
- Subscribe to RSS Feed
- Permalink
- Report to a Moderator
Hi Andy,
My point is the waveform that appear on my front panel is not the same as the ones appearing inside my html report.
The attached pictures showed one of the waveform displayed on the front panel and the other picture showed the waveform generated inside the html report.
Thanks.
Sammmy
02-02-2006 04:34 PM - edited 02-02-2006 04:34 PM
- Mark as New
- Bookmark
- Subscribe
- Mute
- Subscribe to RSS Feed
- Permalink
- Report to a Moderator
I see what you mean now. I couldn't execute your VI, but I recreated something similar that I think replicates your problem. I am simulating a sine wave, and then testing to see if the value is above a certain point, which is similar to part of your application. I would recommend recreating something similar to what is shown below.
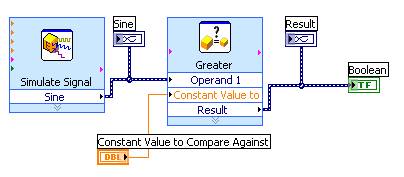
If you do code this, you will notice that your signal is close to the Sine graph and what you are seeing on the HTML is what is on the Result graph. Also I was only able to get the boolean to turn on unless the entire Result Graph is zero. So for your application, you would want to wire whatever wire is going to the Filtered Graph to the HTML report instead of what is coming out of the Compare Express VI.
Hope this helps!
Andy F.
Message Edited by Andy F. on 02-02-2006 04:34 PM
National Instruments
02-09-2006 11:39 AM
- Mark as New
- Bookmark
- Subscribe
- Mute
- Subscribe to RSS Feed
- Permalink
- Report to a Moderator
Hi Andy,
Many thanks for your help!
How do I also display a FFT graph on my front panel? Right now, I have the graph in time, I also want to perform analysis in the frequency plot.
I tried connecting to a FFT VI but it can only display the numbers on the front panel.
Sammmy
02-10-2006 04:50 PM
- Mark as New
- Bookmark
- Subscribe
- Mute
- Subscribe to RSS Feed
- Permalink
- Report to a Moderator
Are you using the Spectral Measurements Express VI? If so, you should be able to just wire the signal in the time domain to the signals input and right click on the output and select create graph indicator. That should take care of getting the FFT graph on the Front Panel. One caution about the right-clicking, selecting the graph is usually only an option from Express VIs.
Hope this helps!
Andy F.
National Instruments
02-18-2006 01:05 AM
- Mark as New
- Bookmark
- Subscribe
- Mute
- Subscribe to RSS Feed
- Permalink
- Report to a Moderator
Hi Andy,
Thanks alot for your help! It's working.
I have another problem, I'm adding the "SMTP Email Send File.VI" and the "SMTP Email Send Message (Small).VI" inside the Report VI to send the html report generated and some text messages to a specific email address.
The error out generate this "530 5.7.0 Must issue a STARTTLS command first t70sm526810pyg" and "502 5.5.1 Unrecognized command d13sm518524pyd"
The mail server I'm using is smtp.gmail.com. The return address is my own email account with gmail.
Regards,
Sammmy
02-20-2006 09:44 AM
- Mark as New
- Bookmark
- Subscribe
- Mute
- Subscribe to RSS Feed
- Permalink
- Report to a Moderator
Hi,
I have another urgent problem!
I have modified the "Report" VI to print AND at the same time saved a copy of the report in html format.
But how can I further modified it to keep generate new reports rather than keep prompting me to replace the existing html report.
I want it to be like the "write LVM" VI where it will generate another lvm file one after another and NOT prompting me to replace the existing file.
My program runs in such a way that once the acquired waveform exceeds a certain range, a sound and a led indicator will goes off and trigger the creation of a html report. This will run continuously, so, in the case of running the program, the the waveform exceeds the specified range 5 times, I would want to have 5 html report generated and NOT pausing the program to prompt me to overwrite and replace the existing html report.
Can someone help me please?
Attached is my modified "Report" VI.
Thanks!!
Regards,
Sammmy
02-21-2006 06:32 AM
- Mark as New
- Bookmark
- Subscribe
- Mute
- Subscribe to RSS Feed
- Permalink
- Report to a Moderator
Hi,
Change the path where you are saving the report each time you are saving the report to a file. You can use something like report1, report2,report3 etc. as the file names. This would ensure that LabVIEW does not prompt you every time if you want to replace the file.
Regards,
Ankita
02-21-2006 08:33 AM
- Mark as New
- Bookmark
- Subscribe
- Mute
- Subscribe to RSS Feed
- Permalink
- Report to a Moderator
Hi Ankita,
I appreciate your help but I do not want to stop my program and change the file name.
It has to run continuously and each time the LED lights up with a sound alarm, a new report (eg report1) will be generated. This will continue untill the next alarm sounds off and report2 will be generated.
Sammmy
02-21-2006 11:29 AM
- Mark as New
- Bookmark
- Subscribe
- Mute
- Subscribe to RSS Feed
- Permalink
- Report to a Moderator
Hi Sammy,
But you dont need to stop your program to change the filename. You can build this functionality into your VI. Every time an alarm sounds off generate a number and append that number to a string to create the new file name by using the "concatenate strings" function. Now use the "string to path" function in LabVIEW to change the datatype of the string to a filepath.
Ankita
02-26-2006 02:04 AM
- Mark as New
- Bookmark
- Subscribe
- Mute
- Subscribe to RSS Feed
- Permalink
- Report to a Moderator
