Turn on suggestions
Auto-suggest helps you quickly narrow down your search results by suggesting possible matches as you type.
Showing results for
Topic Options
- Subscribe to RSS Feed
- Mark Topic as New
- Mark Topic as Read
- Float this Topic for Current User
- Bookmark
- Subscribe
- Mute
- Printer Friendly Page
Manipulate xy-graph to re-define axis value
Member
05-08-2007 02:21 PM
Options
- Mark as New
- Bookmark
- Subscribe
- Mute
- Subscribe to RSS Feed
- Permalink
- Report to a Moderator
Hi!
I have a program that will output to an xy-graph. I now want to change the axis so that the biggest value on my y-axis at the end of the measuremet is set as zero, and all other values changed with respect to the new zero point. I am not sure what i should do to accomplish this. I was wondering if anyone knows how this can be done. The graph is created in a sub-VI and outputed to the main VI afterwards.
Thank you!
Knight of NI
05-08-2007 04:01 PM - edited 05-08-2007 04:01 PM
Options
- Mark as New
- Bookmark
- Subscribe
- Mute
- Subscribe to RSS Feed
- Permalink
- Report to a Moderator
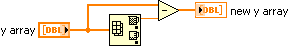
You can use the Array Max&Min function to find the max value and then subtract that from the array.
Message Edited by Dennis Knutson on 05-08-2007 03:01 PM
