- Subscribe to RSS Feed
- Mark Topic as New
- Mark Topic as Read
- Float this Topic for Current User
- Bookmark
- Subscribe
- Mute
- Printer Friendly Page
- « Previous
-
- 1
- 2
- Next »
Periodic writing to graph
10-23-2006 11:39 AM
- Mark as New
- Bookmark
- Subscribe
- Mute
- Subscribe to RSS Feed
- Permalink
- Report to a Moderator
The problem is that everything I have done and all the examples I have found do the acquisition only then they plot the information to the screen. I want to do a 10:30 (10.5 minute) capture at half second intervals and I want the data points to show on the graph as they are recorded. The first data point should be near the left most origin (00:00) and the second one would appear in the pixel column to its right, so on and so forth. The graph should not scroll because the scrollin plot is too hard to follow - what has already been plotted does not move new points extend the plot line to the right..
I have written more of the description to David.
Raymond
10-23-2006 11:39 AM
- Mark as New
- Bookmark
- Subscribe
- Mute
- Subscribe to RSS Feed
- Permalink
- Report to a Moderator
10-23-2006 11:46 AM
- Mark as New
- Bookmark
- Subscribe
- Mute
- Subscribe to RSS Feed
- Permalink
- Report to a Moderator
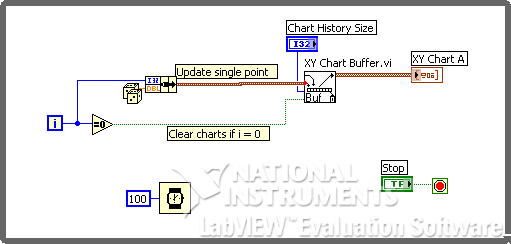
Something is not setup right on my computer because that VI acts like this;
Number of Measurements was set to 50
Delay is 1 second
Nothing happens for 49 seconds then all the information is plotted.
I want it to plot each number the random number generator produces every second on the second.
Raymond
10-23-2006 11:53 AM - edited 10-23-2006 11:53 AM
- Mark as New
- Bookmark
- Subscribe
- Mute
- Subscribe to RSS Feed
- Permalink
- Report to a Moderator
Message Edited by Dennis Knutson on 10-23-2006 10:54 AM
10-23-2006 11:54 AM
- Mark as New
- Bookmark
- Subscribe
- Mute
- Subscribe to RSS Feed
- Permalink
- Report to a Moderator
Whoops, wrong vi ![]() I based this on an example and fell into the File -> Save As trap and modified the one in the examples folder.
I based this on an example and fell into the File -> Save As trap and modified the one in the examples folder.
Here is the right one
Sorry about that
David
10-23-2006 12:03 PM
- Mark as New
- Bookmark
- Subscribe
- Mute
- Subscribe to RSS Feed
- Permalink
- Report to a Moderator
I will build around that.
Dennis, I will study your example but I require a cursor to measure elapsed time which apparently is not possible to use in charts.
Raymond
10-23-2006 12:08 PM
- Mark as New
- Bookmark
- Subscribe
- Mute
- Subscribe to RSS Feed
- Permalink
- Report to a Moderator
10-23-2006 01:20 PM
- Mark as New
- Bookmark
- Subscribe
- Mute
- Subscribe to RSS Feed
- Permalink
- Report to a Moderator
Sorry that should have been 5 stars. I'll rate another message.
Raymond
- « Previous
-
- 1
- 2
- Next »
