- Subscribe to RSS Feed
- Mark Topic as New
- Mark Topic as Read
- Float this Topic for Current User
- Bookmark
- Subscribe
- Mute
- Printer Friendly Page
Polar Plot.vi
06-20-2008 11:19 AM
- Mark as New
- Bookmark
- Subscribe
- Mute
- Subscribe to RSS Feed
- Permalink
- Report to a Moderator
Thank You.
Dmitry
Moscow
06-20-2008 12:03 PM
- Mark as New
- Bookmark
- Subscribe
- Mute
- Subscribe to RSS Feed
- Permalink
- Report to a Moderator
06-22-2008 10:53 PM
- Mark as New
- Bookmark
- Subscribe
- Mute
- Subscribe to RSS Feed
- Permalink
- Report to a Moderator
06-23-2008 07:26 AM - edited 06-23-2008 07:26 AM
- Mark as New
- Bookmark
- Subscribe
- Mute
- Subscribe to RSS Feed
- Permalink
- Report to a Moderator
Message Edited by JoeLabView on 06-23-2008 08:26 AM
06-23-2008 10:37 AM - edited 06-23-2008 10:40 AM
- Mark as New
- Bookmark
- Subscribe
- Mute
- Subscribe to RSS Feed
- Permalink
- Report to a Moderator
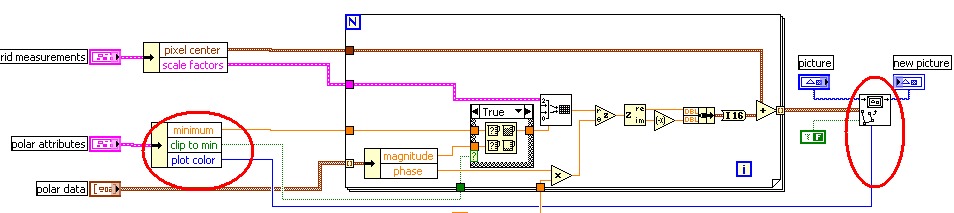
Perhaps you could move the draw multiple lines vi to inside the for loop. Replace it with a draw line vi. Feed the picture around the loop with a shift register and write to the same picture multiple times. This would let you use the color input to the draw line.vi with a different color for each iteration. Might have to manipulate or reorder the data that you are sending.
Also see this thread.
http://forums.ni.com/ni/board/message?board.id=170&message.id=134753&query.id=28545#M134753
Message Edited by unclebump on 06-23-2008 10:40 AM
