- Subscribe to RSS Feed
- Mark Topic as New
- Mark Topic as Read
- Float this Topic for Current User
- Bookmark
- Subscribe
- Mute
- Printer Friendly Page
Temperature Graph
02-02-2007 01:57 PM
- Mark as New
- Bookmark
- Subscribe
- Mute
- Subscribe to RSS Feed
- Permalink
- Report to a Moderator
02-02-2007 03:10 PM - edited 02-02-2007 03:10 PM
- Mark as New
- Bookmark
- Subscribe
- Mute
- Subscribe to RSS Feed
- Permalink
- Report to a Moderator
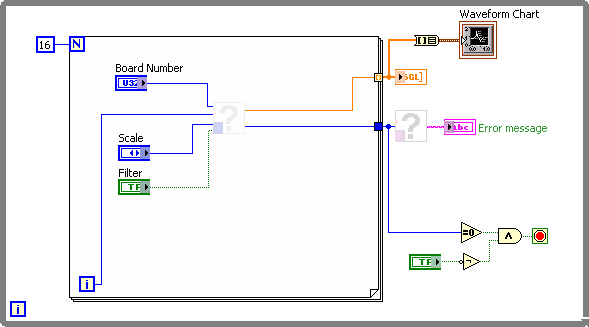
You didn't include the subVIs TIn or ERRMSG. Where did you get this example? Is it for use with an NI data acquisition board or something else? From the simple example (and hideously colored, btw), it looks like you are only taking a measurement from one channel at a time so you are doing a scan at all. I would suggest as a simple fix that you replace the while loop with a for loop and wire the channel input to the iteration terminal to scan through the channels. Autoindedthe results and use an Array to Cluster function (set for 16 elements) and wire that to a chart instead of a graph. A chart is designed to display data as it is acquired. something like the attached.
If you are using an NI DAQ board, then it's much simpler to set up a multi-channel scan. If that's the case, you should look at some of the shipping data acquisition examples.
Message Edited by Dennis Knutson on 02-02-2007 02:10 PM
02-05-2007 08:17 AM
- Mark as New
- Bookmark
- Subscribe
- Mute
- Subscribe to RSS Feed
- Permalink
- Report to a Moderator
I used the XTin example that came with the UL software.
Attached is the Vi for the temperature1 (XTin)
Attached is the BJsample & BJsample1 (XTinScan)
Thanks
02-05-2007 08:38 AM
- Mark as New
- Bookmark
- Subscribe
- Mute
- Subscribe to RSS Feed
- Permalink
- Report to a Moderator
02-05-2007 09:42 AM
- Mark as New
- Bookmark
- Subscribe
- Mute
- Subscribe to RSS Feed
- Permalink
- Report to a Moderator
There's a Universal Library (UL) for LabView users guide & measurement computing. I'm using this as an guide along with the list of UL extension VI program examples to choose from in Labview 7.0
02-05-2007 09:46 AM
- Mark as New
- Bookmark
- Subscribe
- Mute
- Subscribe to RSS Feed
- Permalink
- Report to a Moderator
02-05-2007 09:56 AM
- Mark as New
- Bookmark
- Subscribe
- Mute
- Subscribe to RSS Feed
- Permalink
- Report to a Moderator
When using the Scan example if you lose a thermocouple (open,short) during testing all your thermocouple channels (0-15) will read -9999.99 in the text box and the graph will go flat.
02-05-2007 10:24 AM
- Mark as New
- Bookmark
- Subscribe
- Mute
- Subscribe to RSS Feed
- Permalink
- Report to a Moderator
02-05-2007 01:30 PM
- Mark as New
- Bookmark
- Subscribe
- Mute
- Subscribe to RSS Feed
- Permalink
- Report to a Moderator
02-05-2007 01:56 PM
- Mark as New
- Bookmark
- Subscribe
- Mute
- Subscribe to RSS Feed
- Permalink
- Report to a Moderator
