Turn on suggestions
Auto-suggest helps you quickly narrow down your search results by suggesting possible matches as you type.
Showing results for
Topic Options
- Subscribe to RSS Feed
- Mark Topic as New
- Mark Topic as Read
- Float this Topic for Current User
- Bookmark
- Subscribe
- Mute
- Printer Friendly Page
Waveform Chart only shows one channel or combines both channels?
Member
04-28-2006 12:42 PM
Options
- Mark as New
- Bookmark
- Subscribe
- Mute
- Subscribe to RSS Feed
- Permalink
- Report to a Moderator
Hi,
I have 2 analog input channels and data was obtained by sampling at 500Hz and saved into a text file.
Can any one take a look at my VI and tell me why I am either only getting one curve plotted in the Waveform Chart or it's simply a combination of both of my inputs?
Thanks.
hellolv
I have 2 analog input channels and data was obtained by sampling at 500Hz and saved into a text file.
Can any one take a look at my VI and tell me why I am either only getting one curve plotted in the Waveform Chart or it's simply a combination of both of my inputs?
Thanks.
hellolv
Andy F.
NI Employee (retired)
05-01-2006 12:15 PM - edited 05-01-2006 12:15 PM
Options
- Mark as New
- Bookmark
- Subscribe
- Mute
- Subscribe to RSS Feed
- Permalink
- Report to a Moderator
Hey hellolv!
The issue you are seeing is actually a pretty common one. For a chart to update two plots the input to that chart must be a 2D array. Basically this means that all you need to do is insert a Build Array function right before the chart. I coded a quick example that does this for two random numbers in a while loop.
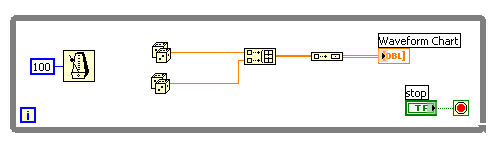
If you have questions I might suggest that you implement this in LabVIEW. You could also check the Context Help (Ctrl+H) and the Charts.VI in the Example Finder (Help » Find Examples).
Hope this helps!
Andy F.
The issue you are seeing is actually a pretty common one. For a chart to update two plots the input to that chart must be a 2D array. Basically this means that all you need to do is insert a Build Array function right before the chart. I coded a quick example that does this for two random numbers in a while loop.
If you have questions I might suggest that you implement this in LabVIEW. You could also check the Context Help (Ctrl+H) and the Charts.VI in the Example Finder (Help » Find Examples).
Hope this helps!
Andy F.
Message Edited by Andy F. on 05-01-2006 12:15 PM
Message Edited by Andy F. on 05-01-2006 12:15 PM
-----------------------------------------------------------------
National Instruments
National Instruments
