- Subscribe to RSS Feed
- Mark Topic as New
- Mark Topic as Read
- Float this Topic for Current User
- Bookmark
- Subscribe
- Mute
- Printer Friendly Page
how do I make an xy graph from DAQmx Read output
07-01-2008 05:53 PM
- Mark as New
- Bookmark
- Subscribe
- Mute
- Subscribe to RSS Feed
- Permalink
- Report to a Moderator
07-01-2008 07:36 PM
- Mark as New
- Bookmark
- Subscribe
- Mute
- Subscribe to RSS Feed
- Permalink
- Report to a Moderator
07-02-2008 09:16 AM
- Mark as New
- Bookmark
- Subscribe
- Mute
- Subscribe to RSS Feed
- Permalink
- Report to a Moderator
What is the output of your DAQmx read? Is it an array of waveforms or a 2-D array of doubles? Or dynamic data?
The output is an array of waveforms. I will give the unbundle array a try. We primarily went to the DAQmx to increase or collection rate and are new to the sub-vi's and are unsure of exactly what we can and can't get away with. Thanks.
07-02-2008 09:56 AM - edited 07-02-2008 09:56 AM
- Mark as New
- Bookmark
- Subscribe
- Mute
- Subscribe to RSS Feed
- Permalink
- Report to a Moderator
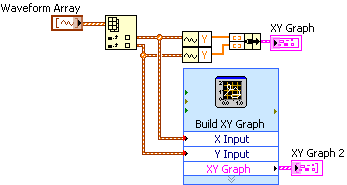
Here are your options with a waveform array. The options are no different with traditional DAQ if you return a waveform data type there.
Message Edited by Dennis Knutson on 07-02-2008 08:56 AM
