- Subscribe to RSS Feed
- Mark Topic as New
- Mark Topic as Read
- Float this Topic for Current User
- Bookmark
- Subscribe
- Mute
- Printer Friendly Page
nonlinear curve fitting for a lead acid battery PLZ HELP
09-16-2007 02:07 AM
- Mark as New
- Bookmark
- Subscribe
- Mute
- Subscribe to RSS Feed
- Permalink
- Report to a Moderator
Im using labview 8 for my solution and my task is to obtain the parameters from a lead acid battery capacity model. For this purpose im planning to use Lev-Mar String.VI and I ve been having problems with the function as I have a problem wiring the model description to the function as i fully dun understand how to do it. Ill hereby attach my program along with the formula to be used. the paramter i have to find are k,c and qmax and il will enter the data for I vs T. Any help regarding this problem is greatly appreciated perhaps a sample VI. so basically my problem is with the model description and how to enter my formula with what control.
09-16-2007 03:02 AM - edited 09-16-2007 03:02 AM
- Mark as New
- Bookmark
- Subscribe
- Mute
- Subscribe to RSS Feed
- Permalink
- Report to a Moderator
- You define qmax as a function of "I", but "I" does not even appear on the right side. 😮
- Is qmax really a function of qmax?
My best guess is that your independent variable is T and the function is q(t) ?
Are the fitting paramters c, qmax while k is the boltzman constant? Anything else? What are reasonable parameter estimates?
What are typical ranges for T?
Can you fix the formula so it makes sense?
Can you attach a typical dataset?
Message Edited by altenbach on 09-16-2007 01:08 AM
09-16-2007 04:17 AM
- Mark as New
- Bookmark
- Subscribe
- Mute
- Subscribe to RSS Feed
- Permalink
- Report to a Moderator
this is the document linking theory
www.ceere.org/rerl/publications/
qmax(I) can be considered just as I (current) i beleive). so the data will be I vs T or I vs Q which is in Ah(ampere hour from Q= IT)
and K is not the boltzman constant as it is the rate constant which is in 1/hrs
ill also attach the data sheet below.
first column is Current (I) in Amperes and Second Column is Capacity Q in (Ah).so we will be plotting capacity on Y axis and current on X axis.. But my main problem is how to feed the above formula to my LEV-Mar String.
09-16-2007 04:26 AM - edited 09-16-2007 04:26 AM
- Mark as New
- Bookmark
- Subscribe
- Mute
- Subscribe to RSS Feed
- Permalink
- Report to a Moderator
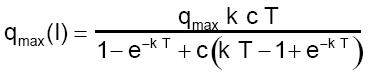
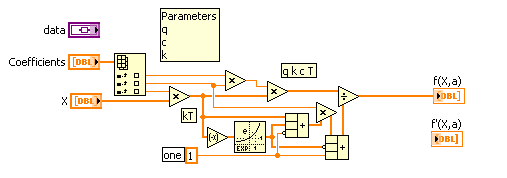
OK, the formula seems to fit well using the VI model (I don't like the formula version)
I(T, q,c,k)=(qkcT)/(1-exp(-kT) + c(kT+exp(-kT) - 1))
T=independent variable, q, c, k=paramters (q=qmax). I would use the VI model. Here's the function.
Message Edited by altenbach on 09-16-2007 02:27 AM
09-16-2007 04:30 AM
- Mark as New
- Bookmark
- Subscribe
- Mute
- Subscribe to RSS Feed
- Permalink
- Report to a Moderator
could you plz provide me with a VI if possible
09-16-2007 04:43 AM
- Mark as New
- Bookmark
- Subscribe
- Mute
- Subscribe to RSS Feed
- Permalink
- Report to a Moderator
Thanks for the reference. I'll study it tomorrow. (it's 2:30am here :o).
You had me condused because T is apparently time, not temperature? Usually uppercase T is temperature and lowercase t is time. Oh well. 🙂
@lil_zu wrote:
...qmax(I) can be considered just as I (current) i beleive). so the data will be I vs T or I vs Q which is in Ah(ampere hour from Q= IT)
first column is Current (I) in Amperes and Second Column is Capacity Q in (Ah).so we will be plotting capacity on Y axis and current on X axis.
So, what is in the third column? I thought current is Y and capacity (or time) on the X-axis?
(The formula string should work too, but it's getting late. I'll look at it tomorrow.)
09-16-2007 04:57 AM
- Mark as New
- Bookmark
- Subscribe
- Mute
- Subscribe to RSS Feed
- Permalink
- Report to a Moderator
the third column is the voltage which is not used in here. this is the data sheet that is used in the document i gave u the link to. first column is is current and second column is capacity. I understand current is Y but from that research paper they have used current on X axis and Capacity on Y axis. I would consult my lecturer and get back to you again tomorrow as i'm also bit confused regarding the situation . btw T is the time "t"..This data is for a discharging of a battery. again thx a lot for helping me
p.s The estimated parameters from the research paper is as follows
k= 0.5874
c=0.3747
qmax=86.1031
09-16-2007 09:19 AM
- Mark as New
- Bookmark
- Subscribe
- Mute
- Subscribe to RSS Feed
- Permalink
- Report to a Moderator
Q(T, q,c,k)=(qkcT)/(1-exp(-kT) + c(kT+exp(-kT) - 1))
Q instead of I so there is no I in the equation and we will be plotting Q on the Y axis and t on the X axis
09-16-2007 12:02 PM
- Mark as New
- Bookmark
- Subscribe
- Mute
- Subscribe to RSS Feed
- Permalink
- Report to a Moderator
Can you make a datafile that contains two colums: Q and t?
I am confused since you don't have a "t" column.
09-16-2007 12:49 PM
- Mark as New
- Bookmark
- Subscribe
- Mute
- Subscribe to RSS Feed
- Permalink
- Report to a Moderator
since we have so many data is it possible to read the values for Q and t from spreadhseet file/text file?
